Alsatian vs Immigrants from Scotland Single Father Poverty
COMPARE
Alsatian
Immigrants from Scotland
Single Father Poverty
Single Father Poverty Comparison
Alsatians
Immigrants from Scotland
17.8%
SINGLE FATHER POVERTY
0.0/ 100
METRIC RATING
283rd/ 347
METRIC RANK
16.7%
SINGLE FATHER POVERTY
9.6/ 100
METRIC RATING
215th/ 347
METRIC RANK
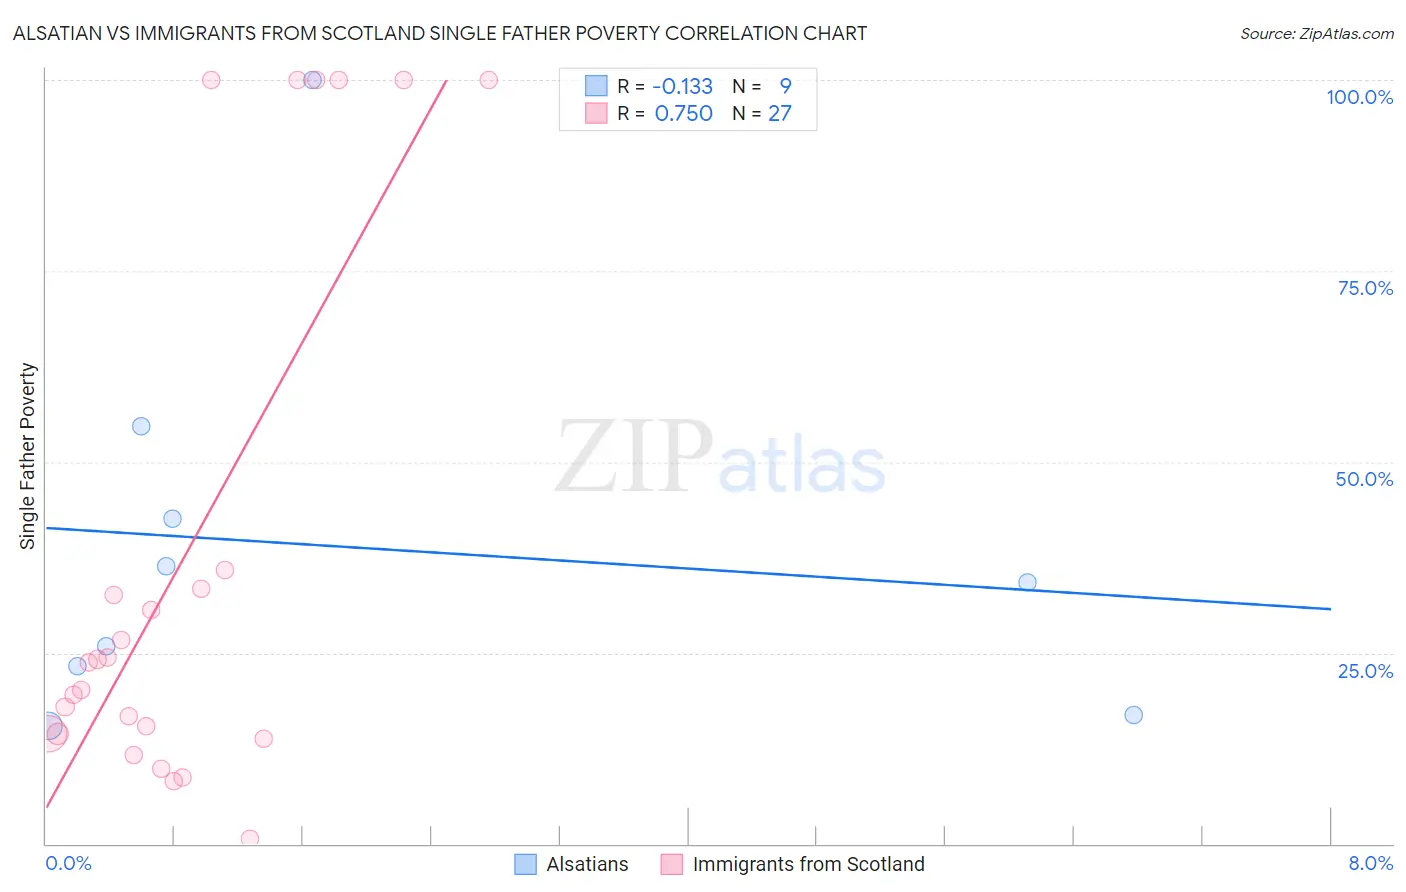
Alsatian vs Immigrants from Scotland Single Father Poverty Correlation Chart
The statistical analysis conducted on geographies consisting of 73,758,627 people shows a poor negative correlation between the proportion of Alsatians and poverty level among single fathers in the United States with a correlation coefficient (R) of -0.133 and weighted average of 17.8%. Similarly, the statistical analysis conducted on geographies consisting of 163,789,782 people shows a strong positive correlation between the proportion of Immigrants from Scotland and poverty level among single fathers in the United States with a correlation coefficient (R) of 0.750 and weighted average of 16.7%, a difference of 6.7%.
Single Father Poverty Correlation Summary
| Measurement | Alsatian | Immigrants from Scotland |
| Minimum | 15.4% | 0.70% |
| Maximum | 100.0% | 100.0% |
| Range | 84.6% | 99.3% |
| Mean | 38.8% | 37.1% |
| Median | 34.2% | 23.7% |
| Interquartile 25% (IQ1) | 20.1% | 14.3% |
| Interquartile 75% (IQ3) | 48.6% | 35.9% |
| Interquartile Range (IQR) | 28.5% | 21.6% |
| Standard Deviation (Sample) | 26.2% | 35.2% |
| Standard Deviation (Population) | 24.7% | 34.6% |
Similar Demographics by Single Father Poverty
Demographics Similar to Alsatians by Single Father Poverty
In terms of single father poverty, the demographic groups most similar to Alsatians are Welsh (17.8%, a difference of 0.020%), English (17.8%, a difference of 0.10%), Dutch (17.8%, a difference of 0.10%), Immigrants from Lebanon (17.9%, a difference of 0.38%), and Scottish (17.7%, a difference of 0.42%).
| Demographics | Rating | Rank | Single Father Poverty |
| German Russians | 0.0 /100 | #276 | Tragic 17.7% |
| Lebanese | 0.0 /100 | #277 | Tragic 17.7% |
| Germans | 0.0 /100 | #278 | Tragic 17.7% |
| Iroquois | 0.0 /100 | #279 | Tragic 17.7% |
| Scottish | 0.0 /100 | #280 | Tragic 17.7% |
| English | 0.0 /100 | #281 | Tragic 17.8% |
| Dutch | 0.0 /100 | #282 | Tragic 17.8% |
| Alsatians | 0.0 /100 | #283 | Tragic 17.8% |
| Welsh | 0.0 /100 | #284 | Tragic 17.8% |
| Immigrants | Lebanon | 0.0 /100 | #285 | Tragic 17.9% |
| Immigrants | North Macedonia | 0.0 /100 | #286 | Tragic 17.9% |
| Carpatho Rusyns | 0.0 /100 | #287 | Tragic 18.0% |
| Bahamians | 0.0 /100 | #288 | Tragic 18.0% |
| Irish | 0.0 /100 | #289 | Tragic 18.0% |
| West Indians | 0.0 /100 | #290 | Tragic 18.0% |
Demographics Similar to Immigrants from Scotland by Single Father Poverty
In terms of single father poverty, the demographic groups most similar to Immigrants from Scotland are Immigrants from England (16.7%, a difference of 0.0%), Cheyenne (16.7%, a difference of 0.030%), Spanish (16.7%, a difference of 0.13%), Immigrants from Uganda (16.7%, a difference of 0.13%), and Ghanaian (16.7%, a difference of 0.17%).
| Demographics | Rating | Rank | Single Father Poverty |
| Eastern Europeans | 13.7 /100 | #208 | Poor 16.6% |
| Europeans | 13.2 /100 | #209 | Poor 16.6% |
| Guatemalans | 12.9 /100 | #210 | Poor 16.6% |
| Arabs | 12.8 /100 | #211 | Poor 16.6% |
| Immigrants | Southern Europe | 11.2 /100 | #212 | Poor 16.7% |
| Ghanaians | 11.0 /100 | #213 | Poor 16.7% |
| Spanish | 10.7 /100 | #214 | Poor 16.7% |
| Immigrants | Scotland | 9.6 /100 | #215 | Tragic 16.7% |
| Immigrants | England | 9.5 /100 | #216 | Tragic 16.7% |
| Cheyenne | 9.3 /100 | #217 | Tragic 16.7% |
| Immigrants | Uganda | 8.6 /100 | #218 | Tragic 16.7% |
| Immigrants | Ghana | 8.1 /100 | #219 | Tragic 16.7% |
| Immigrants | Denmark | 8.1 /100 | #220 | Tragic 16.7% |
| Immigrants | Greece | 8.1 /100 | #221 | Tragic 16.7% |
| Immigrants | Spain | 8.0 /100 | #222 | Tragic 16.7% |