Alsatian vs Laotian Single Father Poverty

COMPARE

Alsatian
Race
Ancestry
AfghanAfricanAlaska NativeAlaskan AthabascanAlbanianAleutAlsatianAmericanApacheArabArapahoArgentineanArmenianAssyrian/Chaldean/SyriacAustralianAustrianBahamianBangladeshiBarbadianBasqueBelgianBelizeanBermudanBhutaneseBlackfeetBolivianBrazilianBritishBritish West IndianBulgarianBurmeseCajunCambodianCanadianCape VerdeanCarpatho RusynCelticCentral AmericanCentral American IndianCherokeeCheyenneChickasawChileanChineseChippewaChoctawColombianColvilleComancheCosta RicanCreeCreekCroatianCrowCubanCypriotCzechCzechoslovakianDanishDelawareDominicanDutchDutch West IndianEastern EuropeanEcuadorianEgyptianEnglishEstonianEthiopianEuropeanFijianFilipinoFinnishFrenchFrench American IndianFrench CanadianGermanGerman RussianGhanaianGreekGuamanian/ChamorroGuatemalanGuyaneseHaitianHmongHonduranHopiHoumaHungarianIcelanderIndian (Asian)IndonesianInupiatIranianIraqiIrishIroquoisIsraeliItalianJamaicanJapaneseJordanianKenyanKiowaKoreanLatvianLebaneseLiberianLithuanianLumbeeLuxembourgerMacedonianMalaysianMalteseMarshalleseMenomineeMexicanMexican American IndianMongolianMoroccanNative HawaiianNavajoNepaleseNew ZealanderNicaraguanNigerianNorthern EuropeanNorwegianOkinawanOsageOttawaPaiutePakistaniPalestinianPanamanianParaguayanPennsylvania GermanPeruvianPimaPolishPortuguesePotawatomiPuebloPuerto RicanPuget Sound SalishRomanianRussianSalvadoranSamoanScandinavianScotch-IrishScottishSeminoleSenegaleseSerbianShoshoneSierra LeoneanSiouxSlavicSlovakSloveneSomaliSouth AfricanSouth AmericanSouth American IndianSoviet UnionSpaniardSpanishSpanish AmericanSpanish American IndianSri LankanSubsaharan AfricanSudaneseSwedishSwissSyrianTaiwaneseThaiTlingit-HaidaTohono O'OdhamTonganTrinidadian and TobagonianTsimshianTurkishU.S. Virgin IslanderUgandanUkrainianUruguayanUteVenezuelanVietnameseWelshWest IndianYakamaYaquiYugoslavianYumanYup'ikZimbabwean
Immigration
NonimmigrantsImmigrantsAfghanistanAfricaAlbaniaArgentinaArmeniaAsiaAustraliaAustriaBahamasBangladeshBarbadosBelarusBelgiumBelizeBoliviaBosnia and HerzegovinaBrazilBulgariaBurma/MyanmarCabo VerdeCambodiaCameroonCanadaCaribbeanCentral AmericaChileChinaColombiaCongoCosta RicaCroatiaCubaCzechoslovakiaDenmarkDominicaDominican RepublicEastern AfricaEastern AsiaEastern EuropeEcuadorEgyptEl SalvadorEnglandEritreaEthiopiaEuropeFijiFranceGermanyGhanaGreeceGrenadaGuatemalaGuyanaHaitiHondurasHong KongHungaryIndiaIndonesiaIranIraqIrelandIsraelItalyJamaicaJapanJordanKazakhstanKenyaKoreaKuwaitLaosLatin AmericaLatviaLebanonLiberiaLithuaniaMalaysiaMexicoMicronesiaMiddle AfricaMoldovaMoroccoNepalNetherlandsNicaraguaNigeriaNorth AmericaNorth MacedoniaNorthern AfricaNorthern EuropeNorwayOceaniaPakistanPanamaPeruPhilippinesPolandPortugalRomaniaRussiaSaudi ArabiaScotlandSenegalSerbiaSierra LeoneSingaporeSomaliaSouth AfricaSouth AmericaSouth Central AsiaSouth Eastern AsiaSouthern EuropeSpainSri LankaSt. Vincent and the GrenadinesSudanSwedenSwitzerlandSyriaTaiwanThailandTrinidad and TobagoTurkeyUgandaUkraineUruguayUzbekistanVenezuelaVietnamWest IndiesWestern AfricaWestern AsiaWestern EuropeYemenZaireZimbabweAzores
Laotian
Race
Ancestry
AfghanAfricanAlaska NativeAlaskan AthabascanAlbanianAleutAmericanApacheArabArapahoArgentineanArmenianAssyrian/Chaldean/SyriacAustralianAustrianBahamianBangladeshiBarbadianBasqueBelgianBelizeanBermudanBhutaneseBlackfeetBolivianBrazilianBritishBritish West IndianBulgarianBurmeseCajunCambodianCanadianCape VerdeanCarpatho RusynCelticCentral AmericanCentral American IndianCherokeeCheyenneChickasawChileanChineseChippewaChoctawColombianColvilleComancheCosta RicanCreeCreekCroatianCrowCubanCypriotCzechCzechoslovakianDanishDelawareDominicanDutchDutch West IndianEastern EuropeanEcuadorianEgyptianEnglishEstonianEthiopianEuropeanFijianFilipinoFinnishFrenchFrench American IndianFrench CanadianGermanGerman RussianGhanaianGreekGuamanian/ChamorroGuatemalanGuyaneseHaitianHmongHonduranHopiHoumaHungarianIcelanderIndian (Asian)IndonesianInupiatIranianIraqiIrishIroquoisIsraeliItalianJamaicanJapaneseJordanianKenyanKiowaKoreanLaotianLatvianLebaneseLiberianLithuanianLumbeeLuxembourgerMacedonianMalaysianMalteseMarshalleseMenomineeMexicanMexican American IndianMongolianMoroccanNative HawaiianNavajoNepaleseNew ZealanderNicaraguanNigerianNorthern EuropeanNorwegianOkinawanOsageOttawaPaiutePakistaniPalestinianPanamanianParaguayanPennsylvania GermanPeruvianPimaPolishPortuguesePotawatomiPuebloPuerto RicanPuget Sound SalishRomanianRussianSalvadoranSamoanScandinavianScotch-IrishScottishSeminoleSenegaleseSerbianShoshoneSierra LeoneanSiouxSlavicSlovakSloveneSomaliSouth AfricanSouth AmericanSouth American IndianSoviet UnionSpaniardSpanishSpanish AmericanSpanish American IndianSri LankanSubsaharan AfricanSudaneseSwedishSwissSyrianTaiwaneseThaiTlingit-HaidaTohono O'OdhamTonganTrinidadian and TobagonianTsimshianTurkishU.S. Virgin IslanderUgandanUkrainianUruguayanUteVenezuelanVietnameseWelshWest IndianYakamaYaquiYugoslavianYumanYup'ikZimbabwean
Immigration
NonimmigrantsImmigrantsAfghanistanAfricaAlbaniaArgentinaArmeniaAsiaAustraliaAustriaBahamasBangladeshBarbadosBelarusBelgiumBelizeBoliviaBosnia and HerzegovinaBrazilBulgariaBurma/MyanmarCabo VerdeCambodiaCameroonCanadaCaribbeanCentral AmericaChileChinaColombiaCongoCosta RicaCroatiaCubaCzechoslovakiaDenmarkDominicaDominican RepublicEastern AfricaEastern AsiaEastern EuropeEcuadorEgyptEl SalvadorEnglandEritreaEthiopiaEuropeFijiFranceGermanyGhanaGreeceGrenadaGuatemalaGuyanaHaitiHondurasHong KongHungaryIndiaIndonesiaIranIraqIrelandIsraelItalyJamaicaJapanJordanKazakhstanKenyaKoreaKuwaitLaosLatin AmericaLatviaLebanonLiberiaLithuaniaMalaysiaMexicoMicronesiaMiddle AfricaMoldovaMoroccoNepalNetherlandsNicaraguaNigeriaNorth AmericaNorth MacedoniaNorthern AfricaNorthern EuropeNorwayOceaniaPakistanPanamaPeruPhilippinesPolandPortugalRomaniaRussiaSaudi ArabiaScotlandSenegalSerbiaSierra LeoneSingaporeSomaliaSouth AfricaSouth AmericaSouth Central AsiaSouth Eastern AsiaSouthern EuropeSpainSri LankaSt. Vincent and the GrenadinesSudanSwedenSwitzerlandSyriaTaiwanThailandTrinidad and TobagoTurkeyUgandaUkraineUruguayUzbekistanVenezuelaVietnamWest IndiesWestern AfricaWestern AsiaWestern EuropeYemenZaireZimbabweAzores
Single Father Poverty
Income
Poverty
Unemployment
Labor Participation
Family Structure
Vehicle Availability
Education Level
Disability

Single Father Poverty Comparison

Alsatians

Laotians

Tragic
Exceptional
17.8%
SINGLE FATHER POVERTY
0.0/ 100
METRIC RATING
283rd/ 347
METRIC RANK
15.1%
SINGLE FATHER POVERTY
99.9/ 100
METRIC RATING
57th/ 347
METRIC RANK

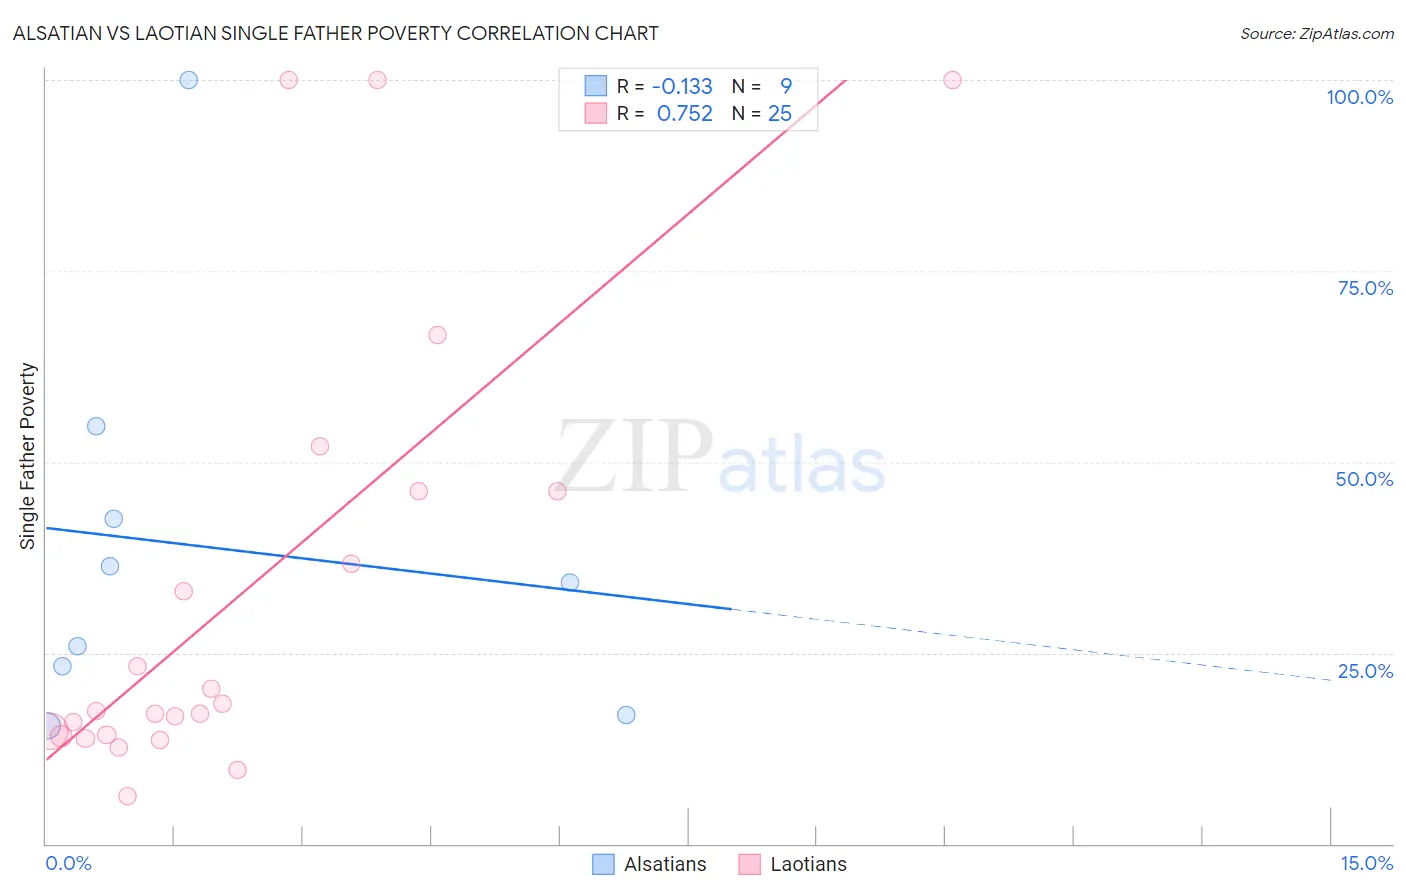
Alsatian vs Laotian Single Father Poverty Correlation Chart

The statistical analysis conducted on geographies consisting of 73,758,627 people shows a poor negative correlation between the proportion of Alsatians and poverty level among single fathers in the United States with a correlation coefficient (R) of -0.133 and weighted average of 17.8%. Similarly, the statistical analysis conducted on geographies consisting of 189,346,173 people shows a strong positive correlation between the proportion of Laotians and poverty level among single fathers in the United States with a correlation coefficient (R) of 0.752 and weighted average of 15.1%, a difference of 18.2%.
Alsatian vs Laotian Single Father Poverty

Single Father Poverty Correlation Summary

MeasurementAlsatianLaotian
Minimum15.4%6.3%
Maximum100.0%100.0%
Range84.6%93.7%
Mean38.8%33.0%
Median34.2%17.4%
Interquartile 25% (IQ1)20.1%14.1%
Interquartile 75% (IQ3)48.6%46.1%
Interquartile Range (IQR)28.5%32.0%
Standard Deviation (Sample)26.2%29.3%
Standard Deviation (Population)24.7%28.7%

Similar Demographics by Single Father Poverty

Demographics Similar to Alsatians by Single Father Poverty

In terms of single father poverty, the demographic groups most similar to Alsatians are Welsh (17.8%, a difference of 0.020%), English (17.8%, a difference of 0.10%), Dutch (17.8%, a difference of 0.10%), Immigrants from Lebanon (17.9%, a difference of 0.38%), and Scottish (17.7%, a difference of 0.42%).
DemographicsRating | RankSingle Father Poverty
German Russians
0.0
/100
|
#276
Tragic
17.7%
Lebanese
0.0
/100
|
#277
Tragic
17.7%
Germans
0.0
/100
|
#278
Tragic
17.7%
Iroquois
0.0
/100
|
#279
Tragic
17.7%
Scottish
0.0
/100
|
#280
Tragic
17.7%
English
0.0
/100
|
#281
Tragic
17.8%
Dutch
0.0
/100
|
#282
Tragic
17.8%
Alsatians
0.0
/100
|
#283
Tragic
17.8%
Welsh
0.0
/100
|
#284
Tragic
17.8%
Immigrants | Lebanon
0.0
/100
|
#285
Tragic
17.9%
Immigrants | North Macedonia
0.0
/100
|
#286
Tragic
17.9%
Carpatho Rusyns
0.0
/100
|
#287
Tragic
18.0%
Bahamians
0.0
/100
|
#288
Tragic
18.0%
Irish
0.0
/100
|
#289
Tragic
18.0%
West Indians
0.0
/100
|
#290
Tragic
18.0%

Demographics Similar to Laotians by Single Father Poverty

In terms of single father poverty, the demographic groups most similar to Laotians are Hawaiian (15.1%, a difference of 0.060%), Immigrants from Laos (15.1%, a difference of 0.090%), Guamanian/Chamorro (15.1%, a difference of 0.15%), Immigrants from Bulgaria (15.0%, a difference of 0.36%), and Immigrants from Uzbekistan (15.0%, a difference of 0.41%).
DemographicsRating | RankSingle Father Poverty
Bhutanese
99.9
/100
|
#50
Exceptional
15.0%
Immigrants | Pakistan
99.9
/100
|
#51
Exceptional
15.0%
Immigrants | El Salvador
99.9
/100
|
#52
Exceptional
15.0%
Immigrants | Kenya
99.9
/100
|
#53
Exceptional
15.0%
Immigrants | Uzbekistan
99.9
/100
|
#54
Exceptional
15.0%
Immigrants | Bulgaria
99.9
/100
|
#55
Exceptional
15.0%
Immigrants | Laos
99.9
/100
|
#56
Exceptional
15.1%
Laotians
99.9
/100
|
#57
Exceptional
15.1%
Hawaiians
99.9
/100
|
#58
Exceptional
15.1%
Guamanians/Chamorros
99.9
/100
|
#59
Exceptional
15.1%
Puget Sound Salish
99.8
/100
|
#60
Exceptional
15.2%
Immigrants | Bosnia and Herzegovina
99.8
/100
|
#61
Exceptional
15.2%
Immigrants | Armenia
99.8
/100
|
#62
Exceptional
15.2%
Immigrants | Sweden
99.8
/100
|
#63
Exceptional
15.2%
Bangladeshis
99.8
/100
|
#64
Exceptional
15.2%