Alsatian vs Creek Single Father Poverty
COMPARE
Alsatian
Creek
Single Father Poverty
Single Father Poverty Comparison
Alsatians
Creek
17.8%
SINGLE FATHER POVERTY
0.0/ 100
METRIC RATING
283rd/ 347
METRIC RANK
19.8%
SINGLE FATHER POVERTY
0.0/ 100
METRIC RATING
322nd/ 347
METRIC RANK
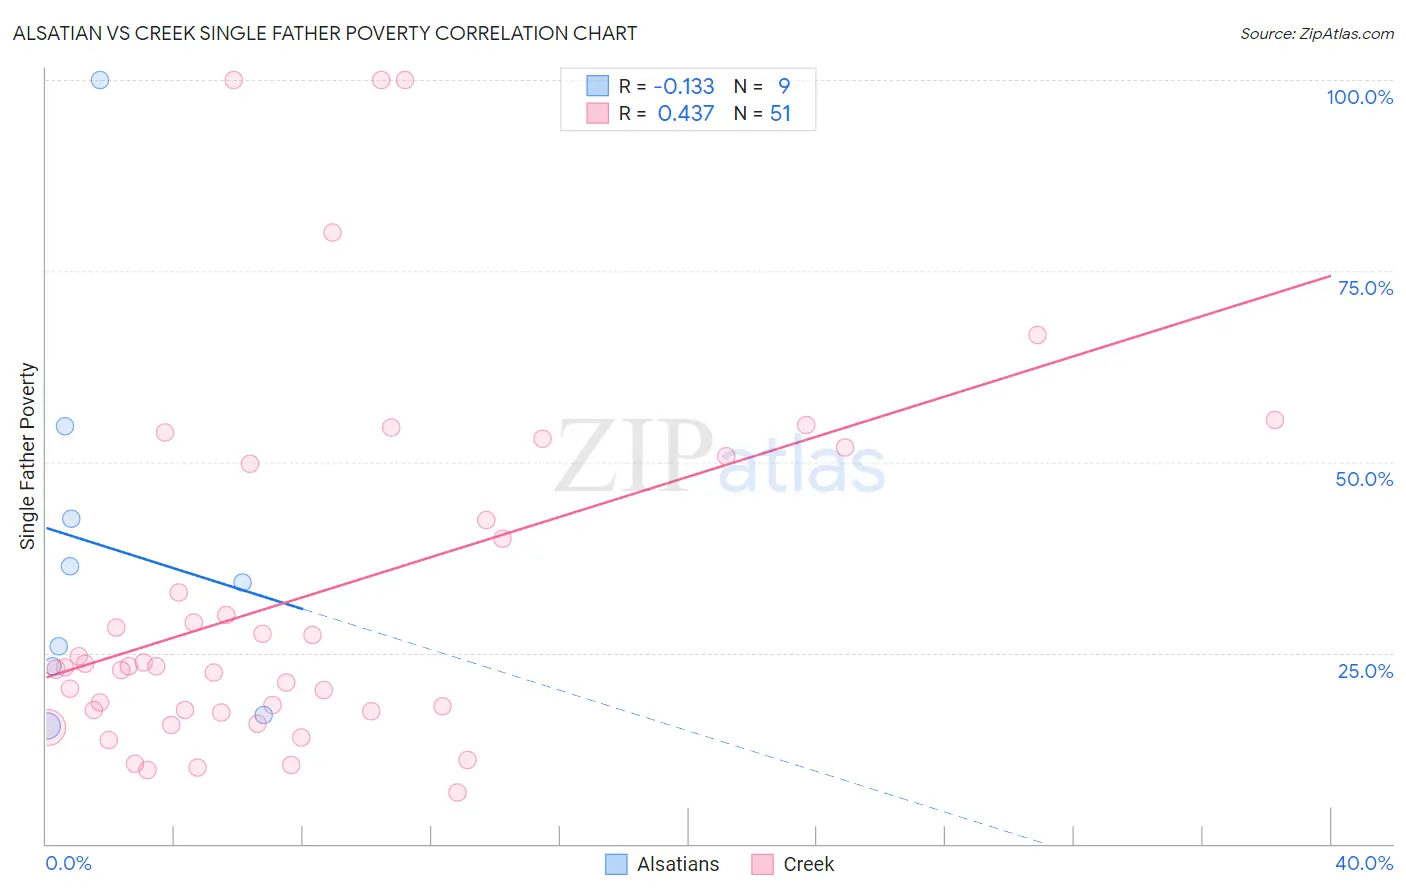
Alsatian vs Creek Single Father Poverty Correlation Chart
The statistical analysis conducted on geographies consisting of 73,758,627 people shows a poor negative correlation between the proportion of Alsatians and poverty level among single fathers in the United States with a correlation coefficient (R) of -0.133 and weighted average of 17.8%. Similarly, the statistical analysis conducted on geographies consisting of 156,600,877 people shows a moderate positive correlation between the proportion of Creek and poverty level among single fathers in the United States with a correlation coefficient (R) of 0.437 and weighted average of 19.8%, a difference of 11.3%.
Single Father Poverty Correlation Summary
| Measurement | Alsatian | Creek |
| Minimum | 15.4% | 6.7% |
| Maximum | 100.0% | 100.0% |
| Range | 84.6% | 93.3% |
| Mean | 38.8% | 32.5% |
| Median | 34.2% | 23.2% |
| Interquartile 25% (IQ1) | 20.1% | 17.4% |
| Interquartile 75% (IQ3) | 48.6% | 49.8% |
| Interquartile Range (IQR) | 28.5% | 32.4% |
| Standard Deviation (Sample) | 26.2% | 23.7% |
| Standard Deviation (Population) | 24.7% | 23.5% |
Similar Demographics by Single Father Poverty
Demographics Similar to Alsatians by Single Father Poverty
In terms of single father poverty, the demographic groups most similar to Alsatians are Welsh (17.8%, a difference of 0.020%), English (17.8%, a difference of 0.10%), Dutch (17.8%, a difference of 0.10%), Immigrants from Lebanon (17.9%, a difference of 0.38%), and Scottish (17.7%, a difference of 0.42%).
| Demographics | Rating | Rank | Single Father Poverty |
| German Russians | 0.0 /100 | #276 | Tragic 17.7% |
| Lebanese | 0.0 /100 | #277 | Tragic 17.7% |
| Germans | 0.0 /100 | #278 | Tragic 17.7% |
| Iroquois | 0.0 /100 | #279 | Tragic 17.7% |
| Scottish | 0.0 /100 | #280 | Tragic 17.7% |
| English | 0.0 /100 | #281 | Tragic 17.8% |
| Dutch | 0.0 /100 | #282 | Tragic 17.8% |
| Alsatians | 0.0 /100 | #283 | Tragic 17.8% |
| Welsh | 0.0 /100 | #284 | Tragic 17.8% |
| Immigrants | Lebanon | 0.0 /100 | #285 | Tragic 17.9% |
| Immigrants | North Macedonia | 0.0 /100 | #286 | Tragic 17.9% |
| Carpatho Rusyns | 0.0 /100 | #287 | Tragic 18.0% |
| Bahamians | 0.0 /100 | #288 | Tragic 18.0% |
| Irish | 0.0 /100 | #289 | Tragic 18.0% |
| West Indians | 0.0 /100 | #290 | Tragic 18.0% |
Demographics Similar to Creek by Single Father Poverty
In terms of single father poverty, the demographic groups most similar to Creek are Pennsylvania German (20.0%, a difference of 0.90%), Cherokee (19.6%, a difference of 1.0%), American (20.1%, a difference of 1.1%), Inupiat (19.5%, a difference of 1.9%), and Black/African American (20.4%, a difference of 2.7%).
| Demographics | Rating | Rank | Single Father Poverty |
| Chickasaw | 0.0 /100 | #315 | Tragic 19.0% |
| Osage | 0.0 /100 | #316 | Tragic 19.0% |
| Dominicans | 0.0 /100 | #317 | Tragic 19.1% |
| Dutch West Indians | 0.0 /100 | #318 | Tragic 19.2% |
| Slovaks | 0.0 /100 | #319 | Tragic 19.3% |
| Inupiat | 0.0 /100 | #320 | Tragic 19.5% |
| Cherokee | 0.0 /100 | #321 | Tragic 19.6% |
| Creek | 0.0 /100 | #322 | Tragic 19.8% |
| Pennsylvania Germans | 0.0 /100 | #323 | Tragic 20.0% |
| Americans | 0.0 /100 | #324 | Tragic 20.1% |
| Blacks/African Americans | 0.0 /100 | #325 | Tragic 20.4% |
| Immigrants | Yemen | 0.0 /100 | #326 | Tragic 20.6% |
| Choctaw | 0.0 /100 | #327 | Tragic 20.7% |
| Pueblo | 0.0 /100 | #328 | Tragic 21.1% |
| Colville | 0.0 /100 | #329 | Tragic 21.4% |