Aleut vs Immigrants from Sweden Poverty
COMPARE
Aleut
Immigrants from Sweden
Poverty
Poverty Comparison
Aleuts
Immigrants from Sweden
12.5%
POVERTY
33.2/ 100
METRIC RATING
189th/ 347
METRIC RANK
11.3%
POVERTY
96.3/ 100
METRIC RATING
83rd/ 347
METRIC RANK
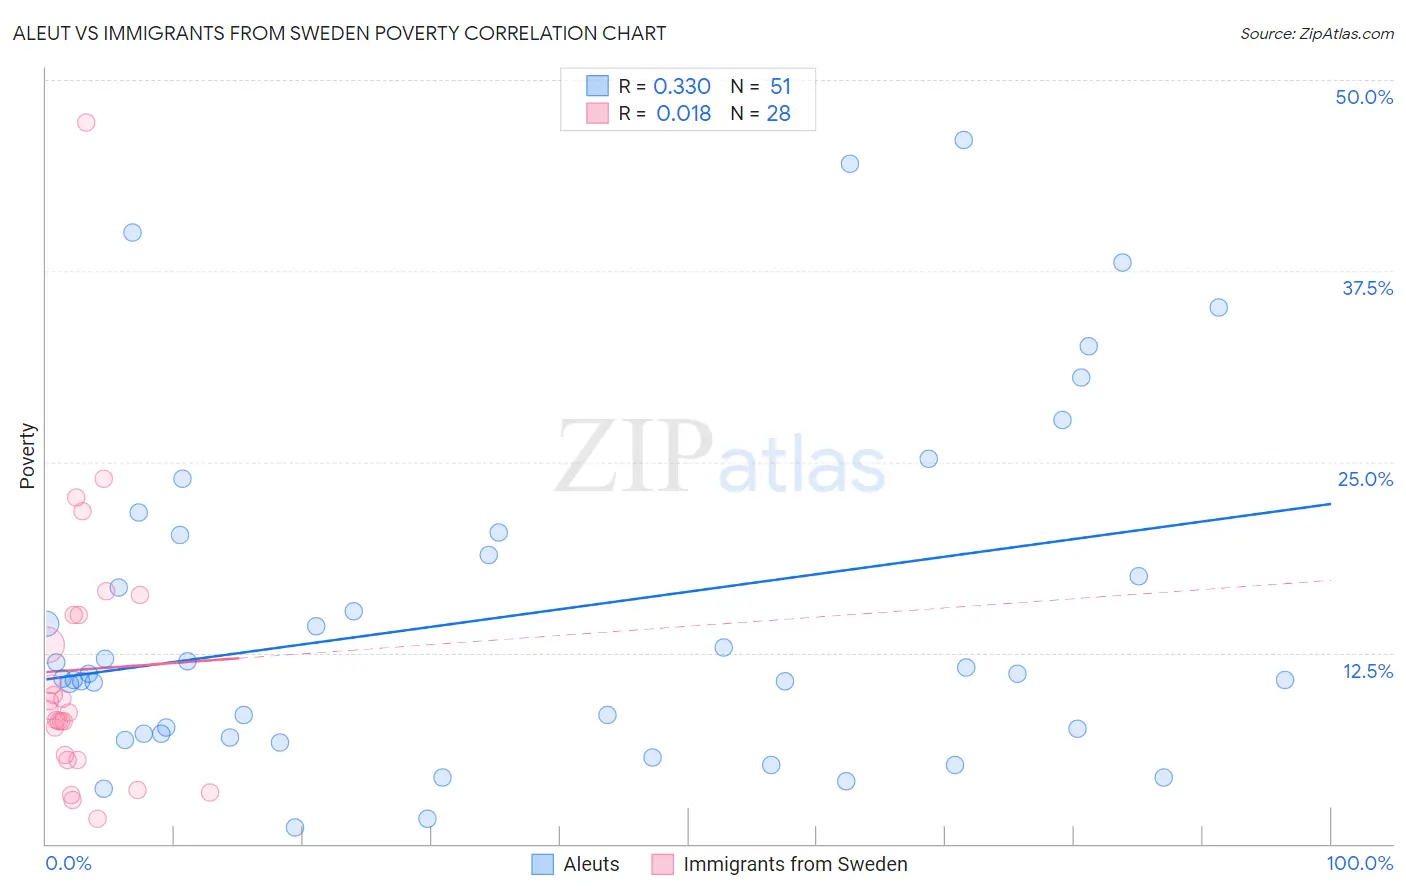
Aleut vs Immigrants from Sweden Poverty Correlation Chart
The statistical analysis conducted on geographies consisting of 61,776,173 people shows a mild positive correlation between the proportion of Aleuts and poverty level in the United States with a correlation coefficient (R) of 0.330 and weighted average of 12.5%. Similarly, the statistical analysis conducted on geographies consisting of 164,694,810 people shows no correlation between the proportion of Immigrants from Sweden and poverty level in the United States with a correlation coefficient (R) of 0.018 and weighted average of 11.3%, a difference of 10.4%.
Poverty Correlation Summary
| Measurement | Aleut | Immigrants from Sweden |
| Minimum | 1.1% | 1.7% |
| Maximum | 46.0% | 47.2% |
| Range | 44.9% | 45.6% |
| Mean | 14.9% | 11.4% |
| Median | 11.1% | 8.7% |
| Interquartile 25% (IQ1) | 7.2% | 5.7% |
| Interquartile 75% (IQ3) | 20.2% | 15.0% |
| Interquartile Range (IQR) | 13.0% | 9.3% |
| Standard Deviation (Sample) | 11.2% | 9.2% |
| Standard Deviation (Population) | 11.1% | 9.1% |
Similar Demographics by Poverty
Demographics Similar to Aleuts by Poverty
In terms of poverty, the demographic groups most similar to Aleuts are Immigrants from Costa Rica (12.5%, a difference of 0.010%), Hawaiian (12.5%, a difference of 0.090%), Immigrants from South America (12.5%, a difference of 0.090%), Sierra Leonean (12.6%, a difference of 0.19%), and Immigrants from Sierra Leone (12.5%, a difference of 0.32%).
| Demographics | Rating | Rank | Poverty |
| Immigrants | Cameroon | 41.7 /100 | #182 | Average 12.4% |
| Immigrants | Iraq | 40.2 /100 | #183 | Average 12.4% |
| Kenyans | 38.8 /100 | #184 | Fair 12.5% |
| Israelis | 36.4 /100 | #185 | Fair 12.5% |
| Immigrants | Sierra Leone | 36.3 /100 | #186 | Fair 12.5% |
| Hawaiians | 34.1 /100 | #187 | Fair 12.5% |
| Immigrants | Costa Rica | 33.3 /100 | #188 | Fair 12.5% |
| Aleuts | 33.2 /100 | #189 | Fair 12.5% |
| Immigrants | South America | 32.3 /100 | #190 | Fair 12.5% |
| Sierra Leoneans | 31.5 /100 | #191 | Fair 12.6% |
| South American Indians | 23.3 /100 | #192 | Fair 12.7% |
| Delaware | 21.4 /100 | #193 | Fair 12.7% |
| Arabs | 21.1 /100 | #194 | Fair 12.7% |
| Immigrants | Kuwait | 20.9 /100 | #195 | Fair 12.7% |
| Iraqis | 20.8 /100 | #196 | Fair 12.7% |
Demographics Similar to Immigrants from Sweden by Poverty
In terms of poverty, the demographic groups most similar to Immigrants from Sweden are English (11.3%, a difference of 0.010%), Immigrants from England (11.4%, a difference of 0.080%), Egyptian (11.3%, a difference of 0.18%), Jordanian (11.4%, a difference of 0.19%), and Northern European (11.4%, a difference of 0.20%).
| Demographics | Rating | Rank | Poverty |
| Immigrants | North America | 96.8 /100 | #76 | Exceptional 11.3% |
| Immigrants | Eastern Asia | 96.7 /100 | #77 | Exceptional 11.3% |
| Dutch | 96.7 /100 | #78 | Exceptional 11.3% |
| Cambodians | 96.7 /100 | #79 | Exceptional 11.3% |
| Indians (Asian) | 96.6 /100 | #80 | Exceptional 11.3% |
| Irish | 96.6 /100 | #81 | Exceptional 11.3% |
| Egyptians | 96.5 /100 | #82 | Exceptional 11.3% |
| Immigrants | Sweden | 96.3 /100 | #83 | Exceptional 11.3% |
| English | 96.3 /100 | #84 | Exceptional 11.3% |
| Immigrants | England | 96.2 /100 | #85 | Exceptional 11.4% |
| Jordanians | 96.0 /100 | #86 | Exceptional 11.4% |
| Northern Europeans | 96.0 /100 | #87 | Exceptional 11.4% |
| Belgians | 95.8 /100 | #88 | Exceptional 11.4% |
| Czechoslovakians | 95.7 /100 | #89 | Exceptional 11.4% |
| Immigrants | Denmark | 95.5 /100 | #90 | Exceptional 11.4% |