Immigrants from Guyana vs Immigrants from Sweden Poverty
COMPARE
Immigrants from Guyana
Immigrants from Sweden
Poverty
Poverty Comparison
Immigrants from Guyana
Immigrants from Sweden
14.5%
POVERTY
0.1/ 100
METRIC RATING
265th/ 347
METRIC RANK
11.3%
POVERTY
96.3/ 100
METRIC RATING
83rd/ 347
METRIC RANK
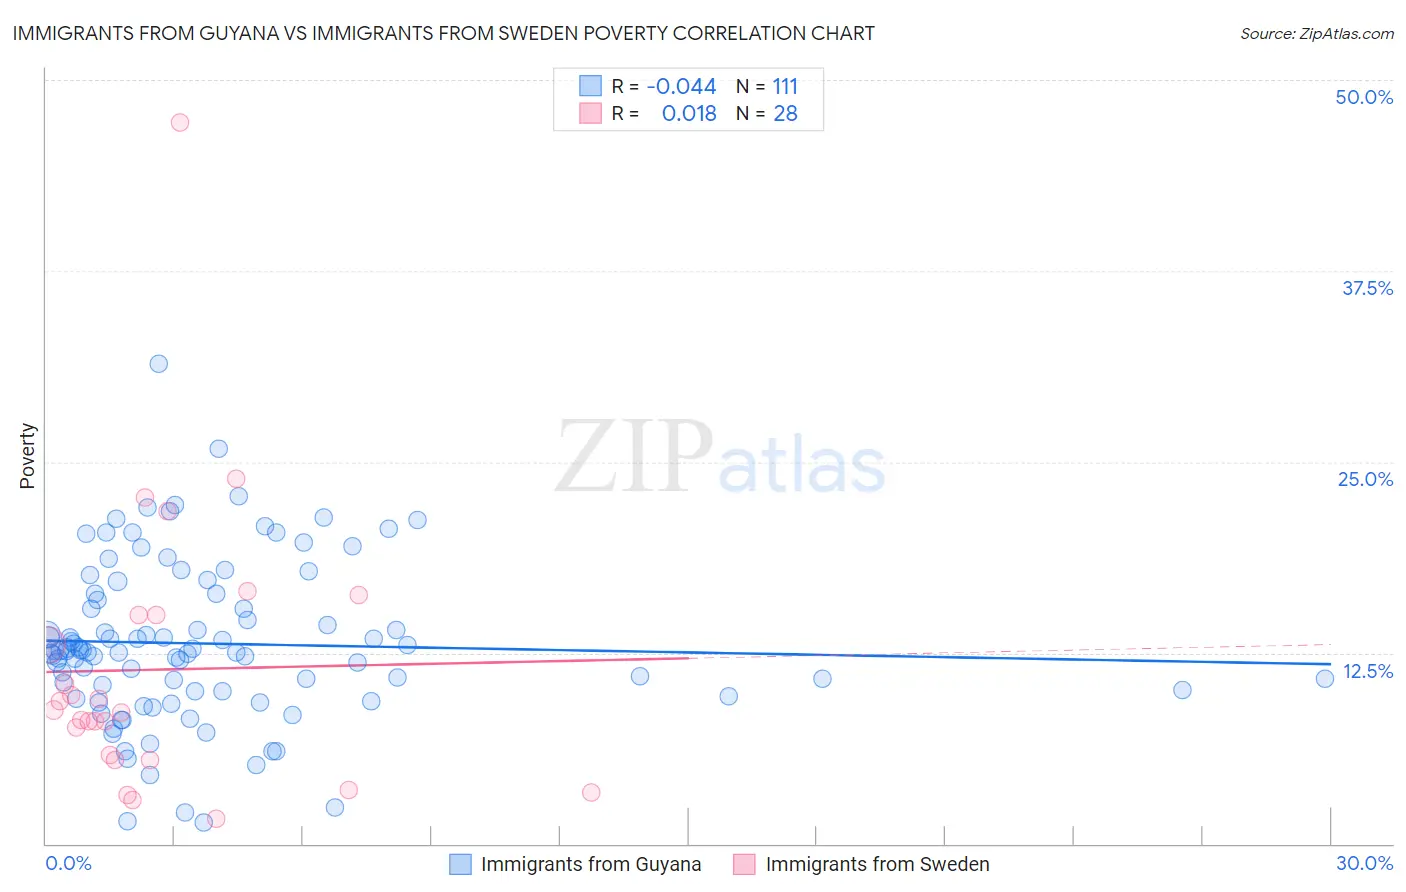
Immigrants from Guyana vs Immigrants from Sweden Poverty Correlation Chart
The statistical analysis conducted on geographies consisting of 183,648,527 people shows no correlation between the proportion of Immigrants from Guyana and poverty level in the United States with a correlation coefficient (R) of -0.044 and weighted average of 14.5%. Similarly, the statistical analysis conducted on geographies consisting of 164,694,810 people shows no correlation between the proportion of Immigrants from Sweden and poverty level in the United States with a correlation coefficient (R) of 0.018 and weighted average of 11.3%, a difference of 27.4%.
Poverty Correlation Summary
| Measurement | Immigrants from Guyana | Immigrants from Sweden |
| Minimum | 1.4% | 1.7% |
| Maximum | 31.4% | 47.2% |
| Range | 30.0% | 45.6% |
| Mean | 13.1% | 11.4% |
| Median | 12.6% | 8.7% |
| Interquartile 25% (IQ1) | 10.0% | 5.7% |
| Interquartile 75% (IQ3) | 16.4% | 15.0% |
| Interquartile Range (IQR) | 6.4% | 9.3% |
| Standard Deviation (Sample) | 5.3% | 9.2% |
| Standard Deviation (Population) | 5.2% | 9.1% |
Similar Demographics by Poverty
Demographics Similar to Immigrants from Guyana by Poverty
In terms of poverty, the demographic groups most similar to Immigrants from Guyana are Immigrants from Jamaica (14.4%, a difference of 0.13%), Guyanese (14.5%, a difference of 0.17%), Jamaican (14.4%, a difference of 0.21%), Iroquois (14.5%, a difference of 0.49%), and Subsaharan African (14.5%, a difference of 0.52%).
| Demographics | Rating | Rank | Poverty |
| Ottawa | 0.1 /100 | #258 | Tragic 14.3% |
| Immigrants | Nicaragua | 0.1 /100 | #259 | Tragic 14.3% |
| Cape Verdeans | 0.1 /100 | #260 | Tragic 14.4% |
| Cherokee | 0.1 /100 | #261 | Tragic 14.4% |
| Immigrants | Liberia | 0.1 /100 | #262 | Tragic 14.4% |
| Jamaicans | 0.1 /100 | #263 | Tragic 14.4% |
| Immigrants | Jamaica | 0.1 /100 | #264 | Tragic 14.4% |
| Immigrants | Guyana | 0.1 /100 | #265 | Tragic 14.5% |
| Guyanese | 0.1 /100 | #266 | Tragic 14.5% |
| Iroquois | 0.1 /100 | #267 | Tragic 14.5% |
| Sub-Saharan Africans | 0.1 /100 | #268 | Tragic 14.5% |
| Immigrants | Cuba | 0.1 /100 | #269 | Tragic 14.6% |
| Central Americans | 0.1 /100 | #270 | Tragic 14.6% |
| Shoshone | 0.0 /100 | #271 | Tragic 14.7% |
| Chickasaw | 0.0 /100 | #272 | Tragic 14.7% |
Demographics Similar to Immigrants from Sweden by Poverty
In terms of poverty, the demographic groups most similar to Immigrants from Sweden are English (11.3%, a difference of 0.010%), Immigrants from England (11.4%, a difference of 0.080%), Egyptian (11.3%, a difference of 0.18%), Jordanian (11.4%, a difference of 0.19%), and Northern European (11.4%, a difference of 0.20%).
| Demographics | Rating | Rank | Poverty |
| Immigrants | North America | 96.8 /100 | #76 | Exceptional 11.3% |
| Immigrants | Eastern Asia | 96.7 /100 | #77 | Exceptional 11.3% |
| Dutch | 96.7 /100 | #78 | Exceptional 11.3% |
| Cambodians | 96.7 /100 | #79 | Exceptional 11.3% |
| Indians (Asian) | 96.6 /100 | #80 | Exceptional 11.3% |
| Irish | 96.6 /100 | #81 | Exceptional 11.3% |
| Egyptians | 96.5 /100 | #82 | Exceptional 11.3% |
| Immigrants | Sweden | 96.3 /100 | #83 | Exceptional 11.3% |
| English | 96.3 /100 | #84 | Exceptional 11.3% |
| Immigrants | England | 96.2 /100 | #85 | Exceptional 11.4% |
| Jordanians | 96.0 /100 | #86 | Exceptional 11.4% |
| Northern Europeans | 96.0 /100 | #87 | Exceptional 11.4% |
| Belgians | 95.8 /100 | #88 | Exceptional 11.4% |
| Czechoslovakians | 95.7 /100 | #89 | Exceptional 11.4% |
| Immigrants | Denmark | 95.5 /100 | #90 | Exceptional 11.4% |