Aleut vs Immigrants from Sweden Female Poverty Among 25-34 Year Olds
COMPARE
Aleut
Immigrants from Sweden
Female Poverty Among 25-34 Year Olds
Female Poverty Among 25-34 Year Olds Comparison
Aleuts
Immigrants from Sweden
16.1%
FEMALE POVERTY AMONG 25-34 YEAR OLDS
0.0/ 100
METRIC RATING
282nd/ 347
METRIC RANK
12.3%
FEMALE POVERTY AMONG 25-34 YEAR OLDS
98.9/ 100
METRIC RATING
74th/ 347
METRIC RANK
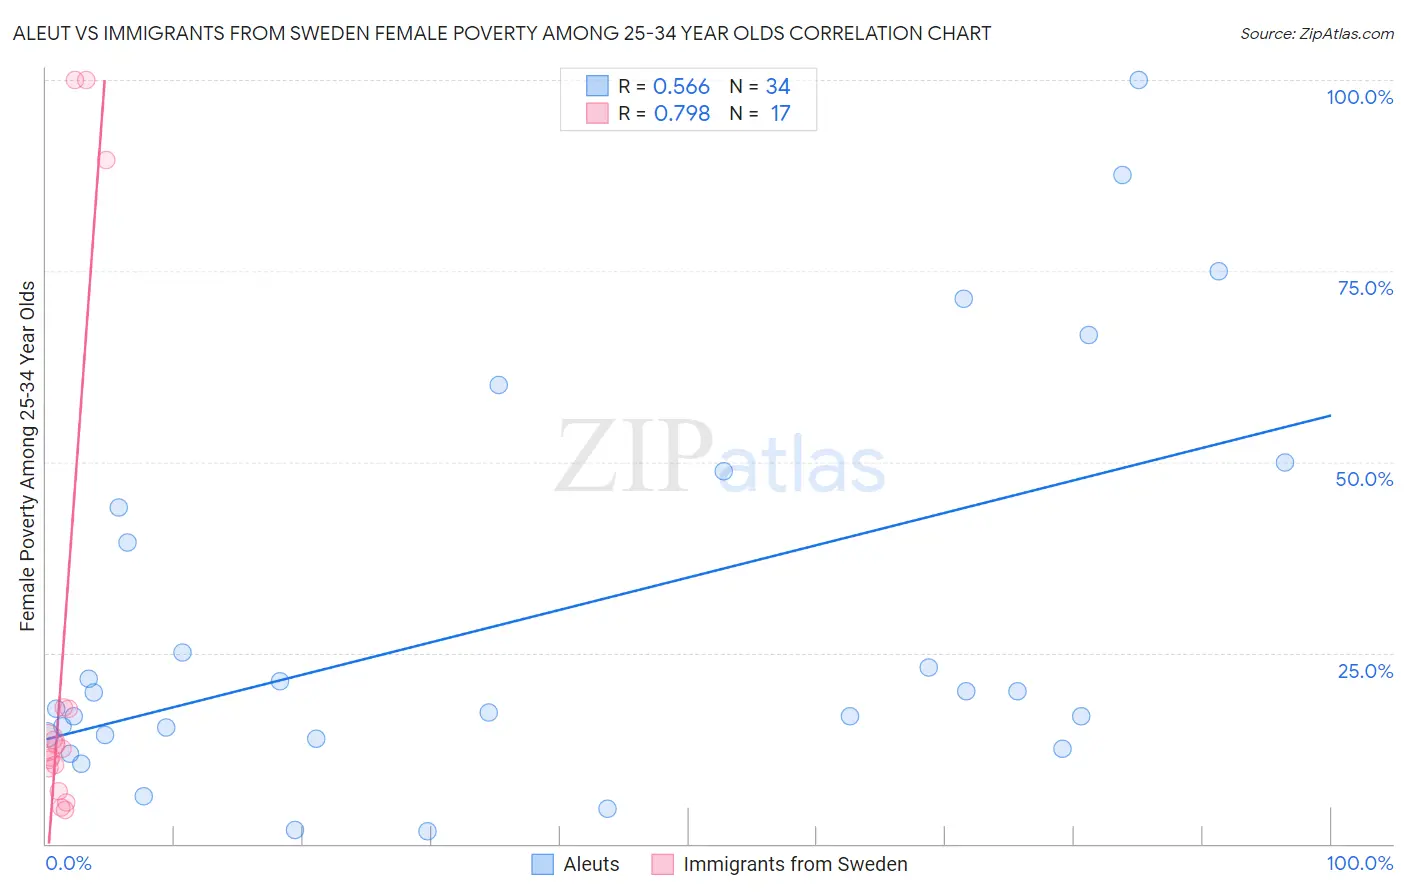
Aleut vs Immigrants from Sweden Female Poverty Among 25-34 Year Olds Correlation Chart
The statistical analysis conducted on geographies consisting of 61,505,480 people shows a substantial positive correlation between the proportion of Aleuts and poverty level among females between the ages 25 and 34 in the United States with a correlation coefficient (R) of 0.566 and weighted average of 16.1%. Similarly, the statistical analysis conducted on geographies consisting of 162,771,885 people shows a strong positive correlation between the proportion of Immigrants from Sweden and poverty level among females between the ages 25 and 34 in the United States with a correlation coefficient (R) of 0.798 and weighted average of 12.3%, a difference of 31.2%.
Female Poverty Among 25-34 Year Olds Correlation Summary
| Measurement | Aleut | Immigrants from Sweden |
| Minimum | 1.6% | 4.3% |
| Maximum | 100.0% | 100.0% |
| Range | 98.4% | 95.7% |
| Mean | 29.4% | 25.9% |
| Median | 18.7% | 12.4% |
| Interquartile 25% (IQ1) | 14.2% | 8.4% |
| Interquartile 75% (IQ3) | 44.1% | 17.8% |
| Interquartile Range (IQR) | 29.8% | 9.4% |
| Standard Deviation (Sample) | 25.6% | 34.0% |
| Standard Deviation (Population) | 25.2% | 32.9% |
Similar Demographics by Female Poverty Among 25-34 Year Olds
Demographics Similar to Aleuts by Female Poverty Among 25-34 Year Olds
In terms of female poverty among 25-34 year olds, the demographic groups most similar to Aleuts are Bahamian (16.1%, a difference of 0.030%), Immigrants from Latin America (16.0%, a difference of 0.66%), Shoshone (16.2%, a difference of 0.87%), Bangladeshi (15.9%, a difference of 1.2%), and French American Indian (15.9%, a difference of 1.3%).
| Demographics | Rating | Rank | Female Poverty Among 25-34 Year Olds |
| Immigrants | Azores | 0.0 /100 | #275 | Tragic 15.8% |
| Immigrants | Zaire | 0.0 /100 | #276 | Tragic 15.8% |
| Immigrants | Micronesia | 0.0 /100 | #277 | Tragic 15.8% |
| French American Indians | 0.0 /100 | #278 | Tragic 15.9% |
| Fijians | 0.0 /100 | #279 | Tragic 15.9% |
| Bangladeshis | 0.0 /100 | #280 | Tragic 15.9% |
| Immigrants | Latin America | 0.0 /100 | #281 | Tragic 16.0% |
| Aleuts | 0.0 /100 | #282 | Tragic 16.1% |
| Bahamians | 0.0 /100 | #283 | Tragic 16.1% |
| Shoshone | 0.0 /100 | #284 | Tragic 16.2% |
| Immigrants | Bahamas | 0.0 /100 | #285 | Tragic 16.3% |
| Cape Verdeans | 0.0 /100 | #286 | Tragic 16.3% |
| Americans | 0.0 /100 | #287 | Tragic 16.4% |
| Guatemalans | 0.0 /100 | #288 | Tragic 16.4% |
| Osage | 0.0 /100 | #289 | Tragic 16.4% |
Demographics Similar to Immigrants from Sweden by Female Poverty Among 25-34 Year Olds
In terms of female poverty among 25-34 year olds, the demographic groups most similar to Immigrants from Sweden are Immigrants from Vietnam (12.3%, a difference of 0.030%), Estonian (12.3%, a difference of 0.050%), Greek (12.3%, a difference of 0.11%), Immigrants from Italy (12.3%, a difference of 0.27%), and Lithuanian (12.2%, a difference of 0.34%).
| Demographics | Rating | Rank | Female Poverty Among 25-34 Year Olds |
| Laotians | 99.2 /100 | #67 | Exceptional 12.2% |
| Sri Lankans | 99.1 /100 | #68 | Exceptional 12.2% |
| Immigrants | Lebanon | 99.1 /100 | #69 | Exceptional 12.2% |
| Immigrants | Belgium | 99.1 /100 | #70 | Exceptional 12.2% |
| Immigrants | Scotland | 99.1 /100 | #71 | Exceptional 12.2% |
| Lithuanians | 99.1 /100 | #72 | Exceptional 12.2% |
| Immigrants | Vietnam | 98.9 /100 | #73 | Exceptional 12.3% |
| Immigrants | Sweden | 98.9 /100 | #74 | Exceptional 12.3% |
| Estonians | 98.9 /100 | #75 | Exceptional 12.3% |
| Greeks | 98.9 /100 | #76 | Exceptional 12.3% |
| Immigrants | Italy | 98.8 /100 | #77 | Exceptional 12.3% |
| Immigrants | Ukraine | 98.6 /100 | #78 | Exceptional 12.3% |
| Immigrants | Jordan | 98.5 /100 | #79 | Exceptional 12.4% |
| Immigrants | Malaysia | 98.3 /100 | #80 | Exceptional 12.4% |
| Immigrants | Kazakhstan | 98.1 /100 | #81 | Exceptional 12.4% |