American vs Immigrants from Sweden Poverty
COMPARE
American
Immigrants from Sweden
Poverty
Poverty Comparison
Americans
Immigrants from Sweden
13.4%
POVERTY
2.9/ 100
METRIC RATING
220th/ 347
METRIC RANK
11.3%
POVERTY
96.3/ 100
METRIC RATING
83rd/ 347
METRIC RANK
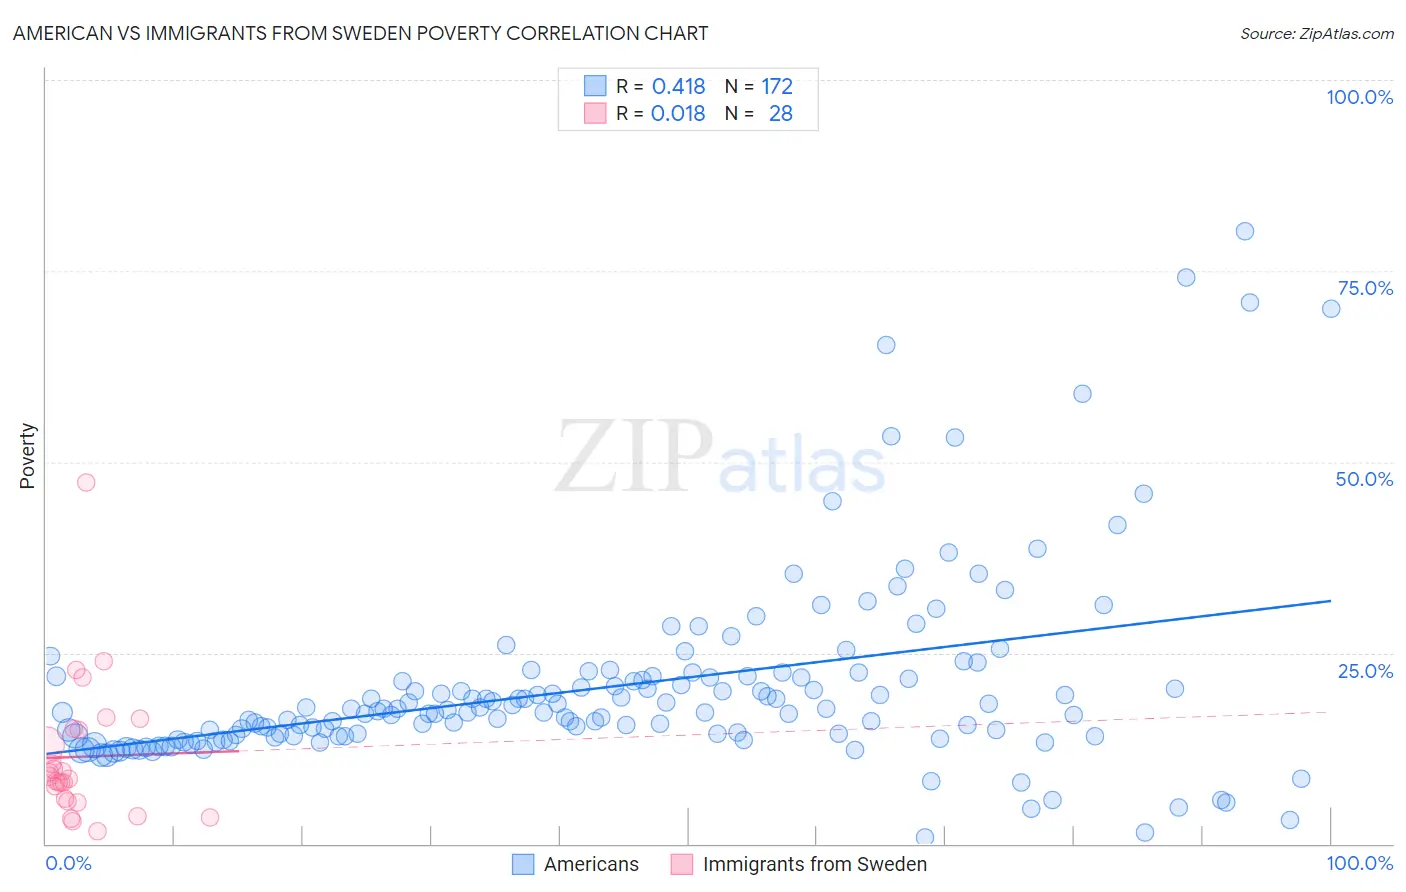
American vs Immigrants from Sweden Poverty Correlation Chart
The statistical analysis conducted on geographies consisting of 580,977,330 people shows a moderate positive correlation between the proportion of Americans and poverty level in the United States with a correlation coefficient (R) of 0.418 and weighted average of 13.4%. Similarly, the statistical analysis conducted on geographies consisting of 164,694,810 people shows no correlation between the proportion of Immigrants from Sweden and poverty level in the United States with a correlation coefficient (R) of 0.018 and weighted average of 11.3%, a difference of 17.8%.
Poverty Correlation Summary
| Measurement | American | Immigrants from Sweden |
| Minimum | 0.85% | 1.7% |
| Maximum | 80.3% | 47.2% |
| Range | 79.4% | 45.6% |
| Mean | 20.5% | 11.4% |
| Median | 17.2% | 8.7% |
| Interquartile 25% (IQ1) | 14.1% | 5.7% |
| Interquartile 75% (IQ3) | 21.9% | 15.0% |
| Interquartile Range (IQR) | 7.8% | 9.3% |
| Standard Deviation (Sample) | 12.6% | 9.2% |
| Standard Deviation (Population) | 12.5% | 9.1% |
Similar Demographics by Poverty
Demographics Similar to Americans by Poverty
In terms of poverty, the demographic groups most similar to Americans are Immigrants from Cambodia (13.4%, a difference of 0.090%), Alsatian (13.4%, a difference of 0.20%), Immigrants from Thailand (13.3%, a difference of 0.21%), Immigrants from Micronesia (13.4%, a difference of 0.24%), and Immigrants from Uzbekistan (13.3%, a difference of 0.28%).
| Demographics | Rating | Rank | Poverty |
| Immigrants | Panama | 4.1 /100 | #213 | Tragic 13.3% |
| Bermudans | 3.7 /100 | #214 | Tragic 13.3% |
| Japanese | 3.3 /100 | #215 | Tragic 13.3% |
| Immigrants | Nonimmigrants | 3.3 /100 | #216 | Tragic 13.3% |
| Immigrants | Uzbekistan | 3.2 /100 | #217 | Tragic 13.3% |
| Immigrants | Thailand | 3.1 /100 | #218 | Tragic 13.3% |
| Immigrants | Cambodia | 3.0 /100 | #219 | Tragic 13.4% |
| Americans | 2.9 /100 | #220 | Tragic 13.4% |
| Alsatians | 2.6 /100 | #221 | Tragic 13.4% |
| Immigrants | Micronesia | 2.6 /100 | #222 | Tragic 13.4% |
| Immigrants | Africa | 2.5 /100 | #223 | Tragic 13.4% |
| Immigrants | Eritrea | 2.4 /100 | #224 | Tragic 13.4% |
| German Russians | 2.2 /100 | #225 | Tragic 13.4% |
| Marshallese | 2.2 /100 | #226 | Tragic 13.4% |
| Alaska Natives | 2.1 /100 | #227 | Tragic 13.5% |
Demographics Similar to Immigrants from Sweden by Poverty
In terms of poverty, the demographic groups most similar to Immigrants from Sweden are English (11.3%, a difference of 0.010%), Immigrants from England (11.4%, a difference of 0.080%), Egyptian (11.3%, a difference of 0.18%), Jordanian (11.4%, a difference of 0.19%), and Northern European (11.4%, a difference of 0.20%).
| Demographics | Rating | Rank | Poverty |
| Immigrants | North America | 96.8 /100 | #76 | Exceptional 11.3% |
| Immigrants | Eastern Asia | 96.7 /100 | #77 | Exceptional 11.3% |
| Dutch | 96.7 /100 | #78 | Exceptional 11.3% |
| Cambodians | 96.7 /100 | #79 | Exceptional 11.3% |
| Indians (Asian) | 96.6 /100 | #80 | Exceptional 11.3% |
| Irish | 96.6 /100 | #81 | Exceptional 11.3% |
| Egyptians | 96.5 /100 | #82 | Exceptional 11.3% |
| Immigrants | Sweden | 96.3 /100 | #83 | Exceptional 11.3% |
| English | 96.3 /100 | #84 | Exceptional 11.3% |
| Immigrants | England | 96.2 /100 | #85 | Exceptional 11.4% |
| Jordanians | 96.0 /100 | #86 | Exceptional 11.4% |
| Northern Europeans | 96.0 /100 | #87 | Exceptional 11.4% |
| Belgians | 95.8 /100 | #88 | Exceptional 11.4% |
| Czechoslovakians | 95.7 /100 | #89 | Exceptional 11.4% |
| Immigrants | Denmark | 95.5 /100 | #90 | Exceptional 11.4% |