Aleut vs Immigrants from Barbados Poverty
COMPARE
Aleut
Immigrants from Barbados
Poverty
Poverty Comparison
Aleuts
Immigrants from Barbados
12.5%
POVERTY
33.2/ 100
METRIC RATING
189th/ 347
METRIC RANK
14.9%
POVERTY
0.0/ 100
METRIC RATING
281st/ 347
METRIC RANK
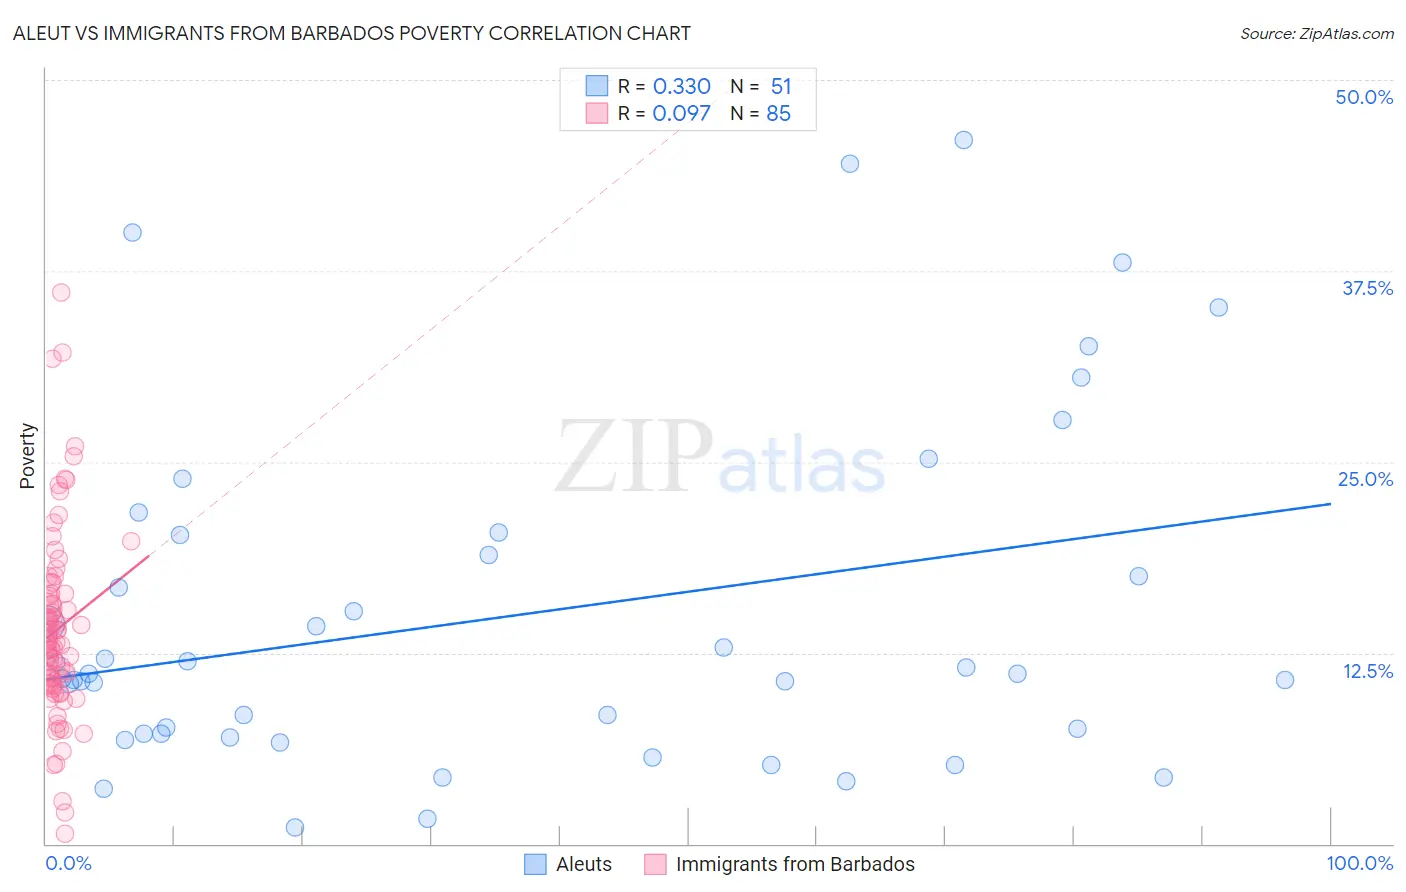
Aleut vs Immigrants from Barbados Poverty Correlation Chart
The statistical analysis conducted on geographies consisting of 61,776,173 people shows a mild positive correlation between the proportion of Aleuts and poverty level in the United States with a correlation coefficient (R) of 0.330 and weighted average of 12.5%. Similarly, the statistical analysis conducted on geographies consisting of 112,771,584 people shows a slight positive correlation between the proportion of Immigrants from Barbados and poverty level in the United States with a correlation coefficient (R) of 0.097 and weighted average of 14.9%, a difference of 19.0%.
Poverty Correlation Summary
| Measurement | Aleut | Immigrants from Barbados |
| Minimum | 1.1% | 0.68% |
| Maximum | 46.0% | 36.1% |
| Range | 44.9% | 35.4% |
| Mean | 14.9% | 14.0% |
| Median | 11.1% | 13.2% |
| Interquartile 25% (IQ1) | 7.2% | 10.4% |
| Interquartile 75% (IQ3) | 20.2% | 16.4% |
| Interquartile Range (IQR) | 13.0% | 6.0% |
| Standard Deviation (Sample) | 11.2% | 6.2% |
| Standard Deviation (Population) | 11.1% | 6.2% |
Similar Demographics by Poverty
Demographics Similar to Aleuts by Poverty
In terms of poverty, the demographic groups most similar to Aleuts are Immigrants from Costa Rica (12.5%, a difference of 0.010%), Hawaiian (12.5%, a difference of 0.090%), Immigrants from South America (12.5%, a difference of 0.090%), Sierra Leonean (12.6%, a difference of 0.19%), and Immigrants from Sierra Leone (12.5%, a difference of 0.32%).
| Demographics | Rating | Rank | Poverty |
| Immigrants | Cameroon | 41.7 /100 | #182 | Average 12.4% |
| Immigrants | Iraq | 40.2 /100 | #183 | Average 12.4% |
| Kenyans | 38.8 /100 | #184 | Fair 12.5% |
| Israelis | 36.4 /100 | #185 | Fair 12.5% |
| Immigrants | Sierra Leone | 36.3 /100 | #186 | Fair 12.5% |
| Hawaiians | 34.1 /100 | #187 | Fair 12.5% |
| Immigrants | Costa Rica | 33.3 /100 | #188 | Fair 12.5% |
| Aleuts | 33.2 /100 | #189 | Fair 12.5% |
| Immigrants | South America | 32.3 /100 | #190 | Fair 12.5% |
| Sierra Leoneans | 31.5 /100 | #191 | Fair 12.6% |
| South American Indians | 23.3 /100 | #192 | Fair 12.7% |
| Delaware | 21.4 /100 | #193 | Fair 12.7% |
| Arabs | 21.1 /100 | #194 | Fair 12.7% |
| Immigrants | Kuwait | 20.9 /100 | #195 | Fair 12.7% |
| Iraqis | 20.8 /100 | #196 | Fair 12.7% |
Demographics Similar to Immigrants from Barbados by Poverty
In terms of poverty, the demographic groups most similar to Immigrants from Barbados are Haitian (14.9%, a difference of 0.070%), Immigrants from St. Vincent and the Grenadines (14.9%, a difference of 0.27%), Comanche (15.0%, a difference of 0.33%), Immigrants from Haiti (15.0%, a difference of 0.45%), and West Indian (15.0%, a difference of 0.55%).
| Demographics | Rating | Rank | Poverty |
| Barbadians | 0.0 /100 | #274 | Tragic 14.8% |
| Immigrants | West Indies | 0.0 /100 | #275 | Tragic 14.8% |
| Immigrants | Bahamas | 0.0 /100 | #276 | Tragic 14.8% |
| Bangladeshis | 0.0 /100 | #277 | Tragic 14.8% |
| Belizeans | 0.0 /100 | #278 | Tragic 14.8% |
| Immigrants | St. Vincent and the Grenadines | 0.0 /100 | #279 | Tragic 14.9% |
| Haitians | 0.0 /100 | #280 | Tragic 14.9% |
| Immigrants | Barbados | 0.0 /100 | #281 | Tragic 14.9% |
| Comanche | 0.0 /100 | #282 | Tragic 15.0% |
| Immigrants | Haiti | 0.0 /100 | #283 | Tragic 15.0% |
| West Indians | 0.0 /100 | #284 | Tragic 15.0% |
| Vietnamese | 0.0 /100 | #285 | Tragic 15.0% |
| Immigrants | Latin America | 0.0 /100 | #286 | Tragic 15.0% |
| Inupiat | 0.0 /100 | #287 | Tragic 15.1% |
| Yaqui | 0.0 /100 | #288 | Tragic 15.1% |