Aleut vs Creek Poverty
COMPARE
Aleut
Creek
Poverty
Poverty Comparison
Aleuts
Creek
12.5%
POVERTY
33.2/ 100
METRIC RATING
189th/ 347
METRIC RANK
15.6%
POVERTY
0.0/ 100
METRIC RATING
306th/ 347
METRIC RANK
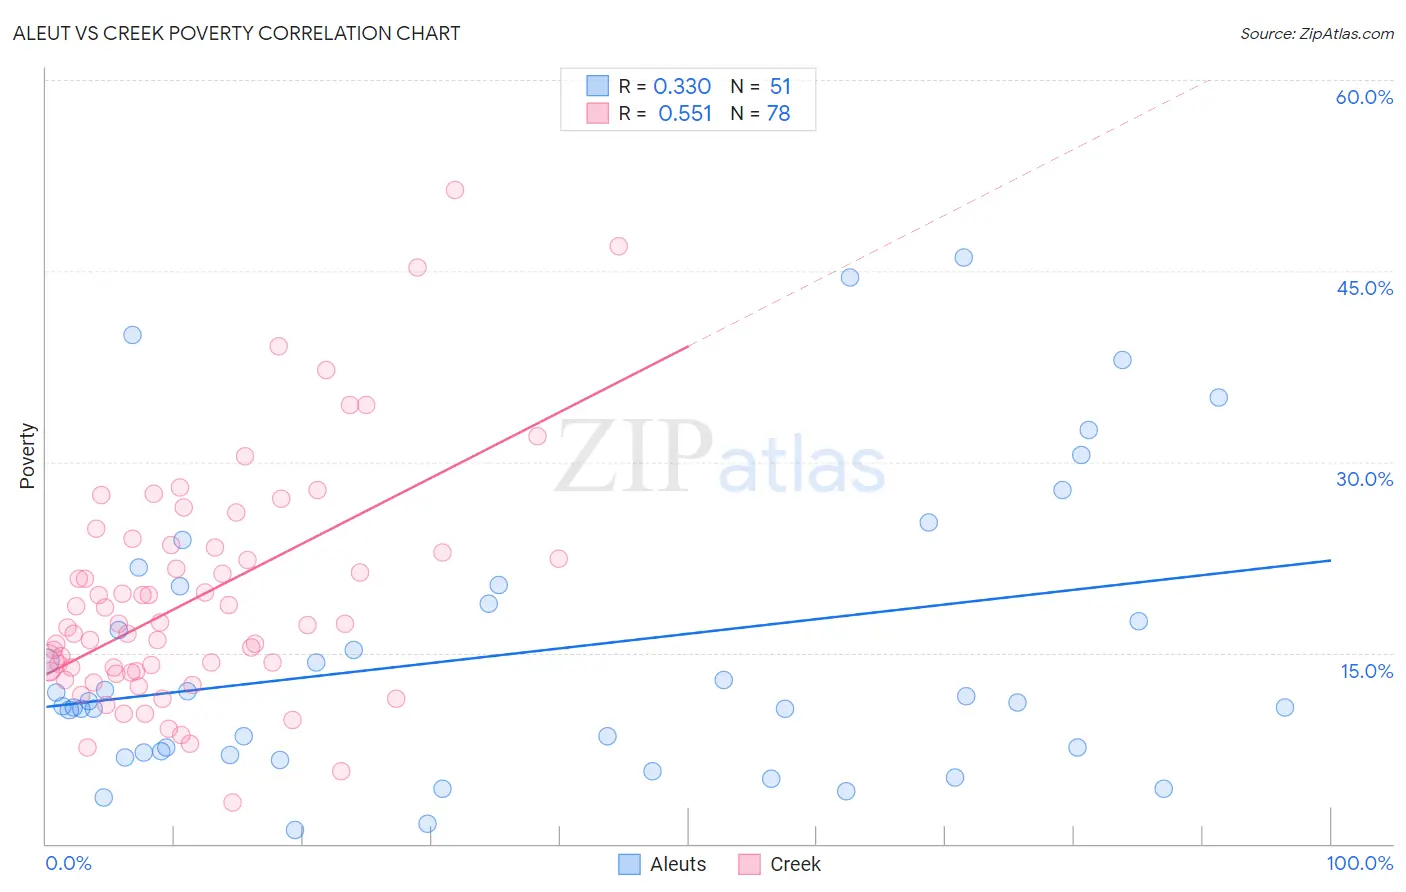
Aleut vs Creek Poverty Correlation Chart
The statistical analysis conducted on geographies consisting of 61,776,173 people shows a mild positive correlation between the proportion of Aleuts and poverty level in the United States with a correlation coefficient (R) of 0.330 and weighted average of 12.5%. Similarly, the statistical analysis conducted on geographies consisting of 178,440,498 people shows a substantial positive correlation between the proportion of Creek and poverty level in the United States with a correlation coefficient (R) of 0.551 and weighted average of 15.6%, a difference of 24.3%.
Poverty Correlation Summary
| Measurement | Aleut | Creek |
| Minimum | 1.1% | 3.2% |
| Maximum | 46.0% | 51.4% |
| Range | 44.9% | 48.1% |
| Mean | 14.9% | 19.4% |
| Median | 11.1% | 17.2% |
| Interquartile 25% (IQ1) | 7.2% | 13.5% |
| Interquartile 75% (IQ3) | 20.2% | 23.3% |
| Interquartile Range (IQR) | 13.0% | 9.7% |
| Standard Deviation (Sample) | 11.2% | 9.2% |
| Standard Deviation (Population) | 11.1% | 9.2% |
Similar Demographics by Poverty
Demographics Similar to Aleuts by Poverty
In terms of poverty, the demographic groups most similar to Aleuts are Immigrants from Costa Rica (12.5%, a difference of 0.010%), Hawaiian (12.5%, a difference of 0.090%), Immigrants from South America (12.5%, a difference of 0.090%), Sierra Leonean (12.6%, a difference of 0.19%), and Immigrants from Sierra Leone (12.5%, a difference of 0.32%).
| Demographics | Rating | Rank | Poverty |
| Immigrants | Cameroon | 41.7 /100 | #182 | Average 12.4% |
| Immigrants | Iraq | 40.2 /100 | #183 | Average 12.4% |
| Kenyans | 38.8 /100 | #184 | Fair 12.5% |
| Israelis | 36.4 /100 | #185 | Fair 12.5% |
| Immigrants | Sierra Leone | 36.3 /100 | #186 | Fair 12.5% |
| Hawaiians | 34.1 /100 | #187 | Fair 12.5% |
| Immigrants | Costa Rica | 33.3 /100 | #188 | Fair 12.5% |
| Aleuts | 33.2 /100 | #189 | Fair 12.5% |
| Immigrants | South America | 32.3 /100 | #190 | Fair 12.5% |
| Sierra Leoneans | 31.5 /100 | #191 | Fair 12.6% |
| South American Indians | 23.3 /100 | #192 | Fair 12.7% |
| Delaware | 21.4 /100 | #193 | Fair 12.7% |
| Arabs | 21.1 /100 | #194 | Fair 12.7% |
| Immigrants | Kuwait | 20.9 /100 | #195 | Fair 12.7% |
| Iraqis | 20.8 /100 | #196 | Fair 12.7% |
Demographics Similar to Creek by Poverty
In terms of poverty, the demographic groups most similar to Creek are African (15.6%, a difference of 0.070%), Choctaw (15.6%, a difference of 0.18%), Seminole (15.6%, a difference of 0.23%), Dutch West Indian (15.6%, a difference of 0.32%), and Immigrants from Guatemala (15.5%, a difference of 0.44%).
| Demographics | Rating | Rank | Poverty |
| Senegalese | 0.0 /100 | #299 | Tragic 15.3% |
| Immigrants | Central America | 0.0 /100 | #300 | Tragic 15.4% |
| Bahamians | 0.0 /100 | #301 | Tragic 15.4% |
| Somalis | 0.0 /100 | #302 | Tragic 15.4% |
| Immigrants | Caribbean | 0.0 /100 | #303 | Tragic 15.5% |
| Immigrants | Mexico | 0.0 /100 | #304 | Tragic 15.5% |
| Immigrants | Guatemala | 0.0 /100 | #305 | Tragic 15.5% |
| Creek | 0.0 /100 | #306 | Tragic 15.6% |
| Africans | 0.0 /100 | #307 | Tragic 15.6% |
| Choctaw | 0.0 /100 | #308 | Tragic 15.6% |
| Seminole | 0.0 /100 | #309 | Tragic 15.6% |
| Dutch West Indians | 0.0 /100 | #310 | Tragic 15.6% |
| Chippewa | 0.0 /100 | #311 | Tragic 15.7% |
| Cajuns | 0.0 /100 | #312 | Tragic 15.7% |
| Immigrants | Grenada | 0.0 /100 | #313 | Tragic 15.8% |