Aleut vs Immigrants from Albania Poverty
COMPARE
Aleut
Immigrants from Albania
Poverty
Poverty Comparison
Aleuts
Immigrants from Albania
12.5%
POVERTY
33.2/ 100
METRIC RATING
189th/ 347
METRIC RANK
12.2%
POVERTY
57.7/ 100
METRIC RATING
165th/ 347
METRIC RANK
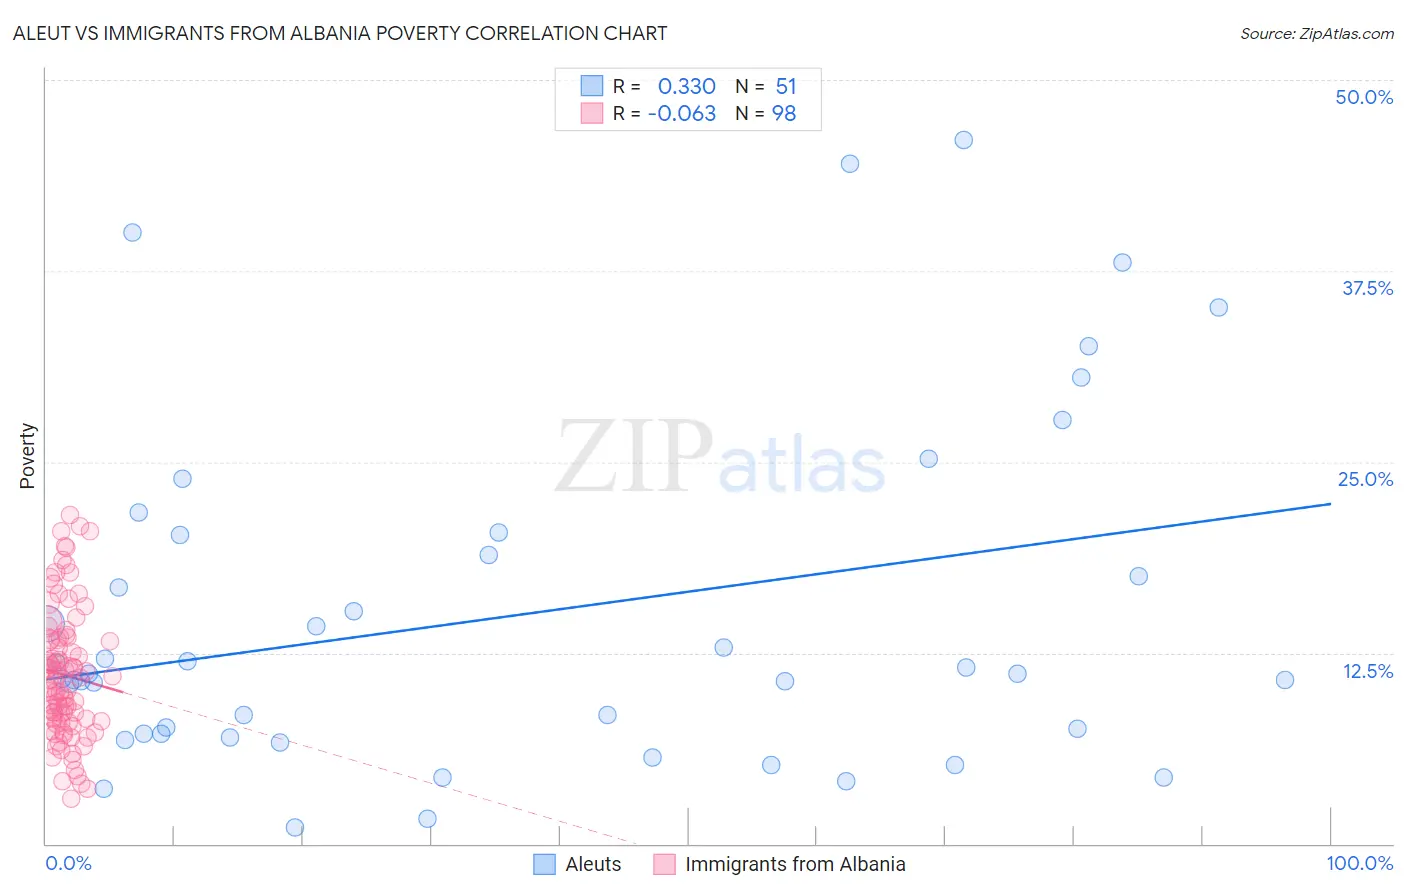
Aleut vs Immigrants from Albania Poverty Correlation Chart
The statistical analysis conducted on geographies consisting of 61,776,173 people shows a mild positive correlation between the proportion of Aleuts and poverty level in the United States with a correlation coefficient (R) of 0.330 and weighted average of 12.5%. Similarly, the statistical analysis conducted on geographies consisting of 119,368,708 people shows a slight negative correlation between the proportion of Immigrants from Albania and poverty level in the United States with a correlation coefficient (R) of -0.063 and weighted average of 12.2%, a difference of 2.5%.
Poverty Correlation Summary
| Measurement | Aleut | Immigrants from Albania |
| Minimum | 1.1% | 3.0% |
| Maximum | 46.0% | 21.5% |
| Range | 44.9% | 18.6% |
| Mean | 14.9% | 11.0% |
| Median | 11.1% | 10.7% |
| Interquartile 25% (IQ1) | 7.2% | 8.0% |
| Interquartile 75% (IQ3) | 20.2% | 13.4% |
| Interquartile Range (IQR) | 13.0% | 5.4% |
| Standard Deviation (Sample) | 11.2% | 4.2% |
| Standard Deviation (Population) | 11.1% | 4.2% |
Similar Demographics by Poverty
Demographics Similar to Aleuts by Poverty
In terms of poverty, the demographic groups most similar to Aleuts are Immigrants from Costa Rica (12.5%, a difference of 0.010%), Hawaiian (12.5%, a difference of 0.090%), Immigrants from South America (12.5%, a difference of 0.090%), Sierra Leonean (12.6%, a difference of 0.19%), and Immigrants from Sierra Leone (12.5%, a difference of 0.32%).
| Demographics | Rating | Rank | Poverty |
| Immigrants | Cameroon | 41.7 /100 | #182 | Average 12.4% |
| Immigrants | Iraq | 40.2 /100 | #183 | Average 12.4% |
| Kenyans | 38.8 /100 | #184 | Fair 12.5% |
| Israelis | 36.4 /100 | #185 | Fair 12.5% |
| Immigrants | Sierra Leone | 36.3 /100 | #186 | Fair 12.5% |
| Hawaiians | 34.1 /100 | #187 | Fair 12.5% |
| Immigrants | Costa Rica | 33.3 /100 | #188 | Fair 12.5% |
| Aleuts | 33.2 /100 | #189 | Fair 12.5% |
| Immigrants | South America | 32.3 /100 | #190 | Fair 12.5% |
| Sierra Leoneans | 31.5 /100 | #191 | Fair 12.6% |
| South American Indians | 23.3 /100 | #192 | Fair 12.7% |
| Delaware | 21.4 /100 | #193 | Fair 12.7% |
| Arabs | 21.1 /100 | #194 | Fair 12.7% |
| Immigrants | Kuwait | 20.9 /100 | #195 | Fair 12.7% |
| Iraqis | 20.8 /100 | #196 | Fair 12.7% |
Demographics Similar to Immigrants from Albania by Poverty
In terms of poverty, the demographic groups most similar to Immigrants from Albania are Colombian (12.2%, a difference of 0.010%), Immigrants from Ethiopia (12.2%, a difference of 0.080%), Venezuelan (12.2%, a difference of 0.090%), Immigrants from Chile (12.2%, a difference of 0.11%), and Immigrants from Venezuela (12.2%, a difference of 0.12%).
| Demographics | Rating | Rank | Poverty |
| Taiwanese | 61.8 /100 | #158 | Good 12.2% |
| Pennsylvania Germans | 60.8 /100 | #159 | Good 12.2% |
| Immigrants | Nepal | 60.4 /100 | #160 | Good 12.2% |
| Immigrants | Fiji | 59.1 /100 | #161 | Average 12.2% |
| Ethiopians | 59.1 /100 | #162 | Average 12.2% |
| Immigrants | Ethiopia | 58.6 /100 | #163 | Average 12.2% |
| Colombians | 57.8 /100 | #164 | Average 12.2% |
| Immigrants | Albania | 57.7 /100 | #165 | Average 12.2% |
| Venezuelans | 56.9 /100 | #166 | Average 12.2% |
| Immigrants | Chile | 56.7 /100 | #167 | Average 12.2% |
| Immigrants | Venezuela | 56.5 /100 | #168 | Average 12.2% |
| Whites/Caucasians | 55.4 /100 | #169 | Average 12.3% |
| Immigrants | Oceania | 54.6 /100 | #170 | Average 12.3% |
| Immigrants | Spain | 51.3 /100 | #171 | Average 12.3% |
| Immigrants | Portugal | 50.5 /100 | #172 | Average 12.3% |