Aleut vs Immigrants from Sweden 9th Grade
COMPARE
Aleut
Immigrants from Sweden
9th Grade
9th Grade Comparison
Aleuts
Immigrants from Sweden
96.0%
9TH GRADE
99.8/ 100
METRIC RATING
58th/ 347
METRIC RANK
95.8%
9TH GRADE
99.5/ 100
METRIC RATING
76th/ 347
METRIC RANK
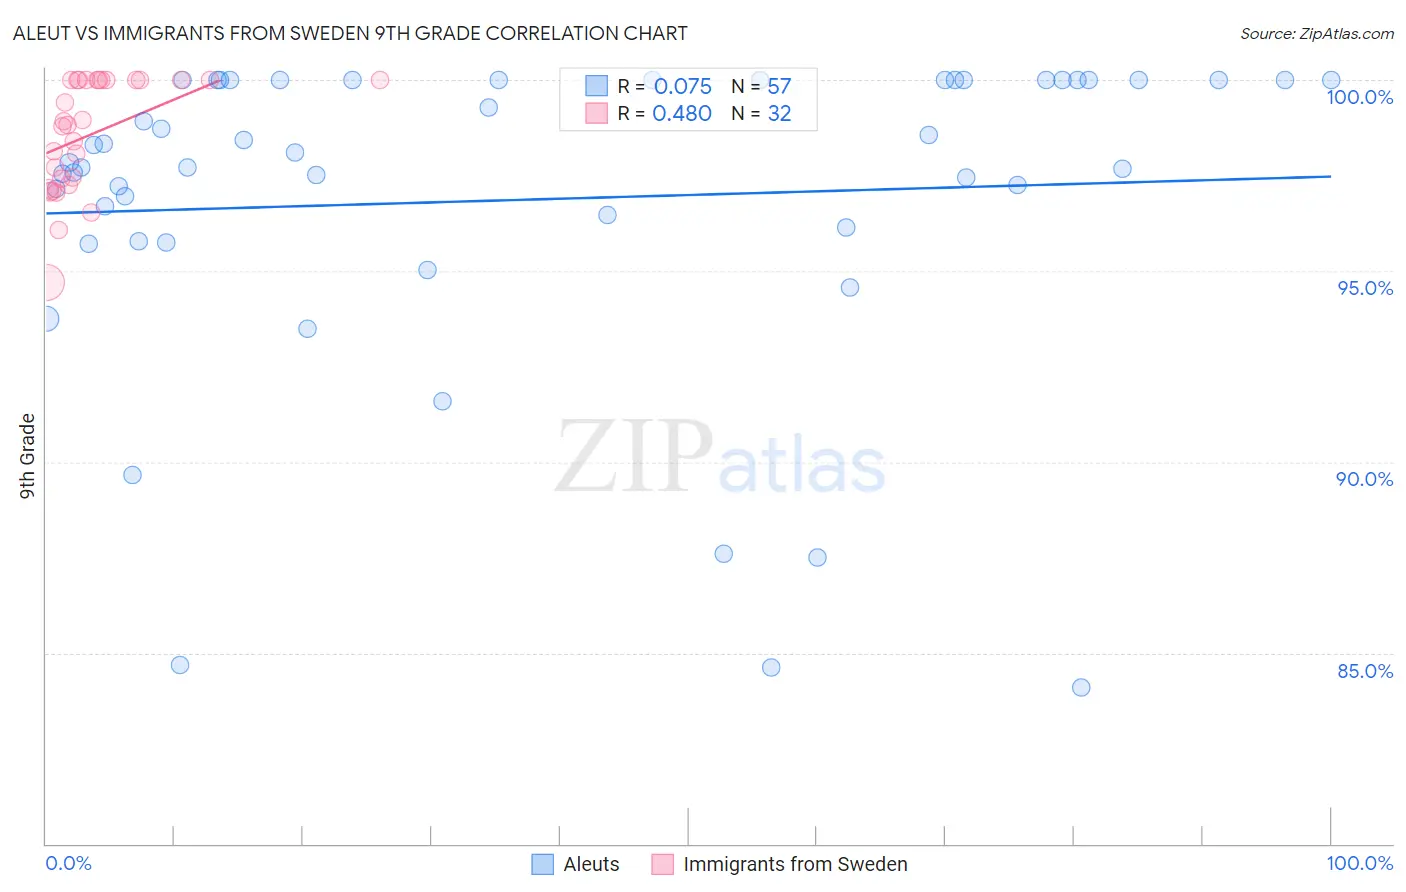
Aleut vs Immigrants from Sweden 9th Grade Correlation Chart
The statistical analysis conducted on geographies consisting of 61,782,786 people shows a slight positive correlation between the proportion of Aleuts and percentage of population with at least 9th grade education in the United States with a correlation coefficient (R) of 0.075 and weighted average of 96.0%. Similarly, the statistical analysis conducted on geographies consisting of 164,736,894 people shows a moderate positive correlation between the proportion of Immigrants from Sweden and percentage of population with at least 9th grade education in the United States with a correlation coefficient (R) of 0.480 and weighted average of 95.8%, a difference of 0.19%.
9th Grade Correlation Summary
| Measurement | Aleut | Immigrants from Sweden |
| Minimum | 84.1% | 94.7% |
| Maximum | 100.0% | 100.0% |
| Range | 15.9% | 5.3% |
| Mean | 96.9% | 98.6% |
| Median | 97.8% | 98.9% |
| Interquartile 25% (IQ1) | 96.0% | 97.3% |
| Interquartile 75% (IQ3) | 100.0% | 100.0% |
| Interquartile Range (IQR) | 4.0% | 2.7% |
| Standard Deviation (Sample) | 4.2% | 1.5% |
| Standard Deviation (Population) | 4.1% | 1.5% |
Demographics Similar to Aleuts and Immigrants from Sweden by 9th Grade
In terms of 9th grade, the demographic groups most similar to Aleuts are Macedonian (96.0%, a difference of 0.0%), New Zealander (95.9%, a difference of 0.020%), Native Hawaiian (95.9%, a difference of 0.030%), Sioux (95.9%, a difference of 0.040%), and Ukrainian (95.9%, a difference of 0.050%). Similarly, the demographic groups most similar to Immigrants from Sweden are Inupiat (95.8%, a difference of 0.010%), White/Caucasian (95.8%, a difference of 0.010%), Immigrants from Singapore (95.8%, a difference of 0.020%), Thai (95.8%, a difference of 0.020%), and Immigrants from Australia (95.8%, a difference of 0.030%).
| Demographics | Rating | Rank | 9th Grade |
| Macedonians | 99.8 /100 | #57 | Exceptional 96.0% |
| Aleuts | 99.8 /100 | #58 | Exceptional 96.0% |
| New Zealanders | 99.8 /100 | #59 | Exceptional 95.9% |
| Native Hawaiians | 99.8 /100 | #60 | Exceptional 95.9% |
| Sioux | 99.8 /100 | #61 | Exceptional 95.9% |
| Ukrainians | 99.7 /100 | #62 | Exceptional 95.9% |
| Canadians | 99.7 /100 | #63 | Exceptional 95.9% |
| Zimbabweans | 99.7 /100 | #64 | Exceptional 95.9% |
| Immigrants | England | 99.6 /100 | #65 | Exceptional 95.9% |
| Immigrants | Netherlands | 99.6 /100 | #66 | Exceptional 95.8% |
| Cypriots | 99.6 /100 | #67 | Exceptional 95.8% |
| Immigrants | Ireland | 99.6 /100 | #68 | Exceptional 95.8% |
| Immigrants | Lithuania | 99.6 /100 | #69 | Exceptional 95.8% |
| Immigrants | Australia | 99.5 /100 | #70 | Exceptional 95.8% |
| Immigrants | Belgium | 99.5 /100 | #71 | Exceptional 95.8% |
| Turks | 99.5 /100 | #72 | Exceptional 95.8% |
| Immigrants | Singapore | 99.5 /100 | #73 | Exceptional 95.8% |
| Thais | 99.5 /100 | #74 | Exceptional 95.8% |
| Inupiat | 99.5 /100 | #75 | Exceptional 95.8% |
| Immigrants | Sweden | 99.5 /100 | #76 | Exceptional 95.8% |
| Whites/Caucasians | 99.4 /100 | #77 | Exceptional 95.8% |