Aleut vs Immigrants from Korea Poverty
COMPARE
Aleut
Immigrants from Korea
Poverty
Poverty Comparison
Aleuts
Immigrants from Korea
12.5%
POVERTY
33.2/ 100
METRIC RATING
189th/ 347
METRIC RANK
10.7%
POVERTY
99.5/ 100
METRIC RATING
28th/ 347
METRIC RANK
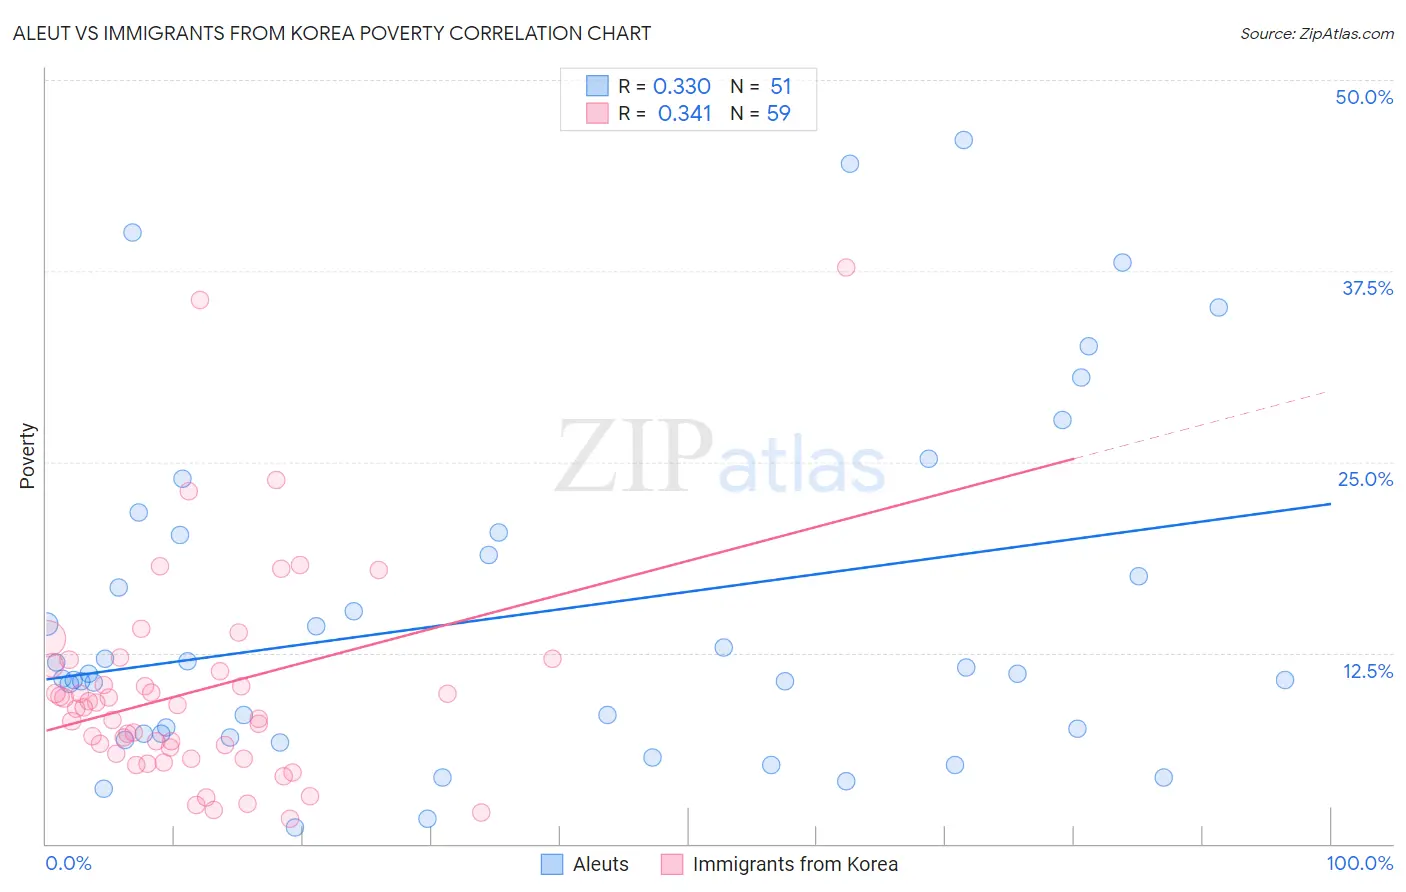
Aleut vs Immigrants from Korea Poverty Correlation Chart
The statistical analysis conducted on geographies consisting of 61,776,173 people shows a mild positive correlation between the proportion of Aleuts and poverty level in the United States with a correlation coefficient (R) of 0.330 and weighted average of 12.5%. Similarly, the statistical analysis conducted on geographies consisting of 415,974,452 people shows a mild positive correlation between the proportion of Immigrants from Korea and poverty level in the United States with a correlation coefficient (R) of 0.341 and weighted average of 10.7%, a difference of 16.9%.
Poverty Correlation Summary
| Measurement | Aleut | Immigrants from Korea |
| Minimum | 1.1% | 1.6% |
| Maximum | 46.0% | 37.7% |
| Range | 44.9% | 36.1% |
| Mean | 14.9% | 10.0% |
| Median | 11.1% | 8.9% |
| Interquartile 25% (IQ1) | 7.2% | 5.9% |
| Interquartile 75% (IQ3) | 20.2% | 11.7% |
| Interquartile Range (IQR) | 13.0% | 5.7% |
| Standard Deviation (Sample) | 11.2% | 7.0% |
| Standard Deviation (Population) | 11.1% | 6.9% |
Similar Demographics by Poverty
Demographics Similar to Aleuts by Poverty
In terms of poverty, the demographic groups most similar to Aleuts are Immigrants from Costa Rica (12.5%, a difference of 0.010%), Hawaiian (12.5%, a difference of 0.090%), Immigrants from South America (12.5%, a difference of 0.090%), Sierra Leonean (12.6%, a difference of 0.19%), and Immigrants from Sierra Leone (12.5%, a difference of 0.32%).
| Demographics | Rating | Rank | Poverty |
| Immigrants | Cameroon | 41.7 /100 | #182 | Average 12.4% |
| Immigrants | Iraq | 40.2 /100 | #183 | Average 12.4% |
| Kenyans | 38.8 /100 | #184 | Fair 12.5% |
| Israelis | 36.4 /100 | #185 | Fair 12.5% |
| Immigrants | Sierra Leone | 36.3 /100 | #186 | Fair 12.5% |
| Hawaiians | 34.1 /100 | #187 | Fair 12.5% |
| Immigrants | Costa Rica | 33.3 /100 | #188 | Fair 12.5% |
| Aleuts | 33.2 /100 | #189 | Fair 12.5% |
| Immigrants | South America | 32.3 /100 | #190 | Fair 12.5% |
| Sierra Leoneans | 31.5 /100 | #191 | Fair 12.6% |
| South American Indians | 23.3 /100 | #192 | Fair 12.7% |
| Delaware | 21.4 /100 | #193 | Fair 12.7% |
| Arabs | 21.1 /100 | #194 | Fair 12.7% |
| Immigrants | Kuwait | 20.9 /100 | #195 | Fair 12.7% |
| Iraqis | 20.8 /100 | #196 | Fair 12.7% |
Demographics Similar to Immigrants from Korea by Poverty
In terms of poverty, the demographic groups most similar to Immigrants from Korea are Immigrants from Northern Europe (10.7%, a difference of 0.070%), Greek (10.7%, a difference of 0.090%), Danish (10.7%, a difference of 0.10%), Polish (10.7%, a difference of 0.19%), and Iranian (10.7%, a difference of 0.27%).
| Demographics | Rating | Rank | Poverty |
| Luxembourgers | 99.7 /100 | #21 | Exceptional 10.6% |
| Eastern Europeans | 99.7 /100 | #22 | Exceptional 10.6% |
| Swedes | 99.7 /100 | #23 | Exceptional 10.6% |
| Italians | 99.7 /100 | #24 | Exceptional 10.6% |
| Croatians | 99.6 /100 | #25 | Exceptional 10.6% |
| Burmese | 99.6 /100 | #26 | Exceptional 10.7% |
| Immigrants | Northern Europe | 99.6 /100 | #27 | Exceptional 10.7% |
| Immigrants | Korea | 99.5 /100 | #28 | Exceptional 10.7% |
| Greeks | 99.5 /100 | #29 | Exceptional 10.7% |
| Danes | 99.5 /100 | #30 | Exceptional 10.7% |
| Poles | 99.5 /100 | #31 | Exceptional 10.7% |
| Iranians | 99.5 /100 | #32 | Exceptional 10.7% |
| Macedonians | 99.4 /100 | #33 | Exceptional 10.8% |
| Immigrants | Poland | 99.4 /100 | #34 | Exceptional 10.8% |
| Tongans | 99.4 /100 | #35 | Exceptional 10.8% |