Aleut vs Scandinavian Poverty
COMPARE
Aleut
Scandinavian
Poverty
Poverty Comparison
Aleuts
Scandinavians
12.5%
POVERTY
33.2/ 100
METRIC RATING
189th/ 347
METRIC RANK
11.1%
POVERTY
98.2/ 100
METRIC RATING
57th/ 347
METRIC RANK
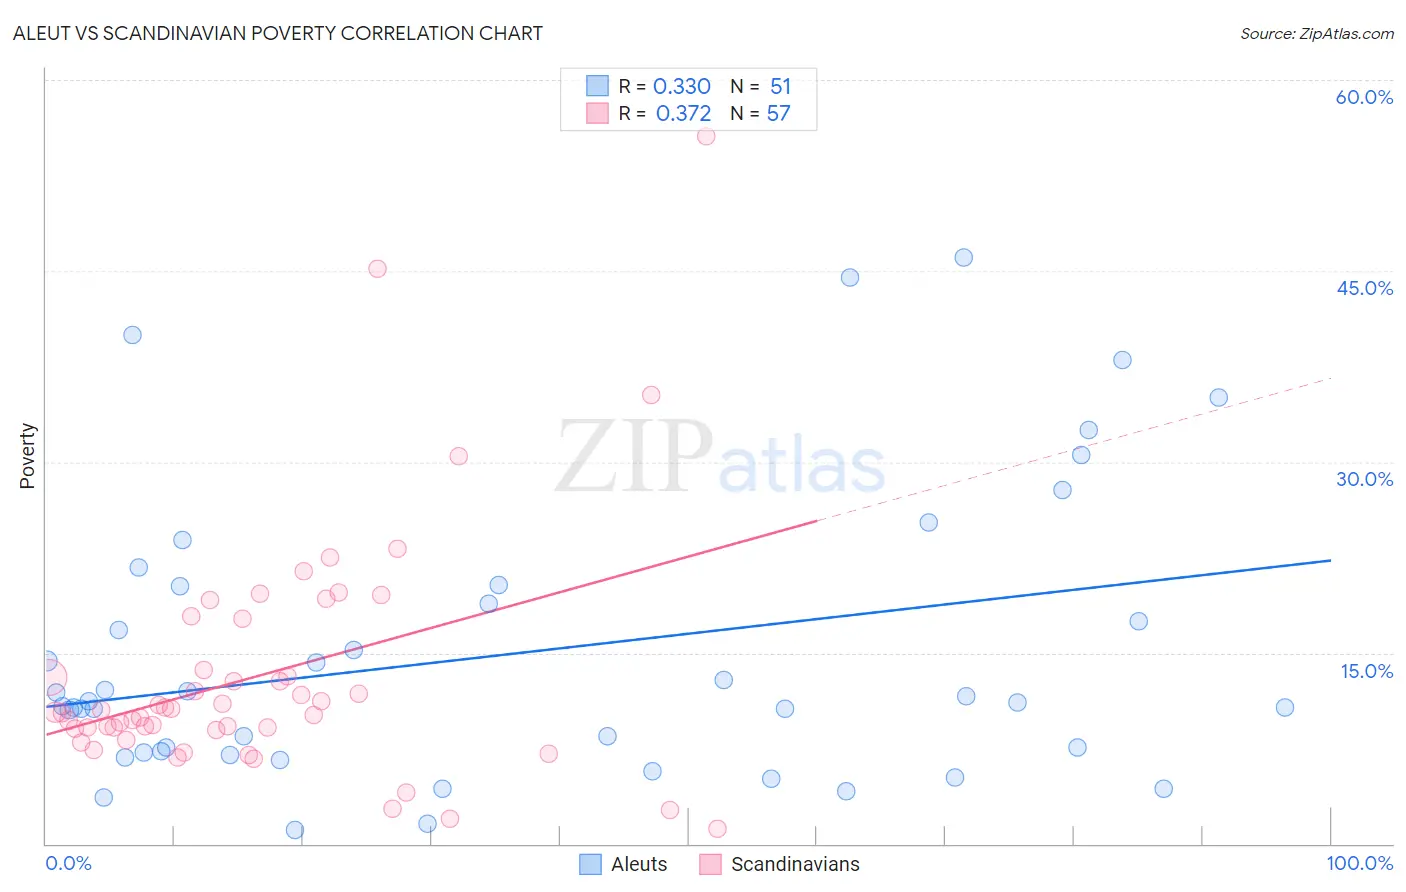
Aleut vs Scandinavian Poverty Correlation Chart
The statistical analysis conducted on geographies consisting of 61,776,173 people shows a mild positive correlation between the proportion of Aleuts and poverty level in the United States with a correlation coefficient (R) of 0.330 and weighted average of 12.5%. Similarly, the statistical analysis conducted on geographies consisting of 472,236,083 people shows a mild positive correlation between the proportion of Scandinavians and poverty level in the United States with a correlation coefficient (R) of 0.372 and weighted average of 11.1%, a difference of 12.6%.
Poverty Correlation Summary
| Measurement | Aleut | Scandinavian |
| Minimum | 1.1% | 1.1% |
| Maximum | 46.0% | 55.6% |
| Range | 44.9% | 54.4% |
| Mean | 14.9% | 13.2% |
| Median | 11.1% | 10.3% |
| Interquartile 25% (IQ1) | 7.2% | 9.0% |
| Interquartile 75% (IQ3) | 20.2% | 15.7% |
| Interquartile Range (IQR) | 13.0% | 6.7% |
| Standard Deviation (Sample) | 11.2% | 9.6% |
| Standard Deviation (Population) | 11.1% | 9.6% |
Similar Demographics by Poverty
Demographics Similar to Aleuts by Poverty
In terms of poverty, the demographic groups most similar to Aleuts are Immigrants from Costa Rica (12.5%, a difference of 0.010%), Hawaiian (12.5%, a difference of 0.090%), Immigrants from South America (12.5%, a difference of 0.090%), Sierra Leonean (12.6%, a difference of 0.19%), and Immigrants from Sierra Leone (12.5%, a difference of 0.32%).
| Demographics | Rating | Rank | Poverty |
| Immigrants | Cameroon | 41.7 /100 | #182 | Average 12.4% |
| Immigrants | Iraq | 40.2 /100 | #183 | Average 12.4% |
| Kenyans | 38.8 /100 | #184 | Fair 12.5% |
| Israelis | 36.4 /100 | #185 | Fair 12.5% |
| Immigrants | Sierra Leone | 36.3 /100 | #186 | Fair 12.5% |
| Hawaiians | 34.1 /100 | #187 | Fair 12.5% |
| Immigrants | Costa Rica | 33.3 /100 | #188 | Fair 12.5% |
| Aleuts | 33.2 /100 | #189 | Fair 12.5% |
| Immigrants | South America | 32.3 /100 | #190 | Fair 12.5% |
| Sierra Leoneans | 31.5 /100 | #191 | Fair 12.6% |
| South American Indians | 23.3 /100 | #192 | Fair 12.7% |
| Delaware | 21.4 /100 | #193 | Fair 12.7% |
| Arabs | 21.1 /100 | #194 | Fair 12.7% |
| Immigrants | Kuwait | 20.9 /100 | #195 | Fair 12.7% |
| Iraqis | 20.8 /100 | #196 | Fair 12.7% |
Demographics Similar to Scandinavians by Poverty
In terms of poverty, the demographic groups most similar to Scandinavians are Estonian (11.1%, a difference of 0.040%), German (11.1%, a difference of 0.060%), Immigrants from Europe (11.2%, a difference of 0.21%), Immigrants from Sri Lanka (11.2%, a difference of 0.37%), and Immigrants from Italy (11.2%, a difference of 0.44%).
| Demographics | Rating | Rank | Poverty |
| Asians | 98.9 /100 | #50 | Exceptional 11.0% |
| Immigrants | Croatia | 98.7 /100 | #51 | Exceptional 11.0% |
| Immigrants | Philippines | 98.7 /100 | #52 | Exceptional 11.0% |
| Immigrants | Austria | 98.6 /100 | #53 | Exceptional 11.1% |
| Immigrants | Bulgaria | 98.5 /100 | #54 | Exceptional 11.1% |
| Immigrants | Serbia | 98.5 /100 | #55 | Exceptional 11.1% |
| Estonians | 98.2 /100 | #56 | Exceptional 11.1% |
| Scandinavians | 98.2 /100 | #57 | Exceptional 11.1% |
| Germans | 98.1 /100 | #58 | Exceptional 11.1% |
| Immigrants | Europe | 98.0 /100 | #59 | Exceptional 11.2% |
| Immigrants | Sri Lanka | 97.9 /100 | #60 | Exceptional 11.2% |
| Immigrants | Italy | 97.9 /100 | #61 | Exceptional 11.2% |
| Austrians | 97.8 /100 | #62 | Exceptional 11.2% |
| Ukrainians | 97.8 /100 | #63 | Exceptional 11.2% |
| Swiss | 97.7 /100 | #64 | Exceptional 11.2% |