Aleut vs Immigrants from Korea High School Diploma
COMPARE
Aleut
Immigrants from Korea
High School Diploma
High School Diploma Comparison
Aleuts
Immigrants from Korea
90.4%
HIGH SCHOOL DIPLOMA
98.0/ 100
METRIC RATING
102nd/ 347
METRIC RANK
90.5%
HIGH SCHOOL DIPLOMA
98.3/ 100
METRIC RATING
98th/ 347
METRIC RANK
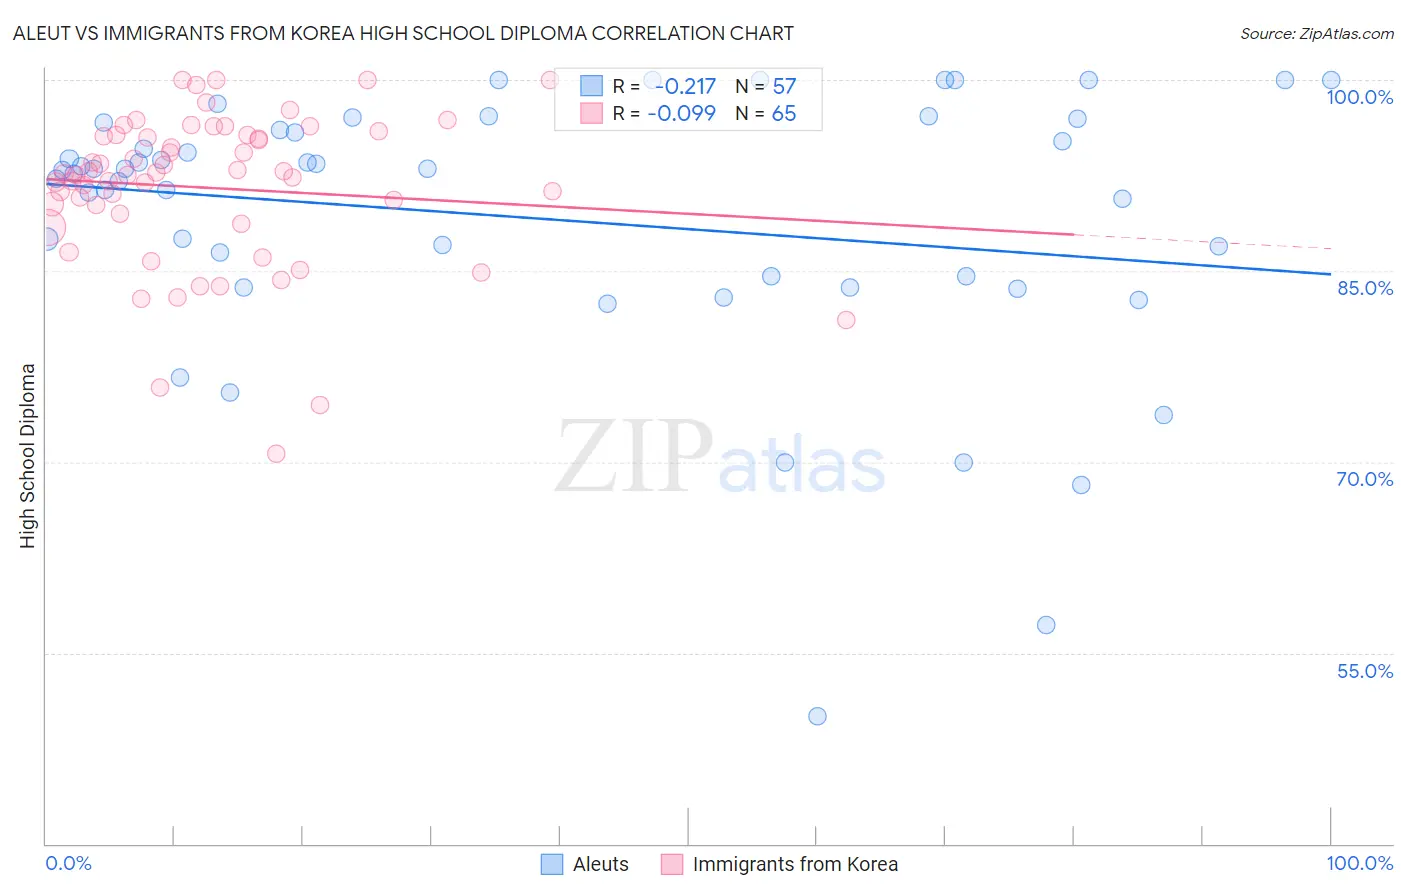
Aleut vs Immigrants from Korea High School Diploma Correlation Chart
The statistical analysis conducted on geographies consisting of 61,782,761 people shows a weak negative correlation between the proportion of Aleuts and percentage of population with at least high school diploma education in the United States with a correlation coefficient (R) of -0.217 and weighted average of 90.4%. Similarly, the statistical analysis conducted on geographies consisting of 416,280,217 people shows a slight negative correlation between the proportion of Immigrants from Korea and percentage of population with at least high school diploma education in the United States with a correlation coefficient (R) of -0.099 and weighted average of 90.5%, a difference of 0.060%.
High School Diploma Correlation Summary
| Measurement | Aleut | Immigrants from Korea |
| Minimum | 50.0% | 70.6% |
| Maximum | 100.0% | 100.0% |
| Range | 50.0% | 29.4% |
| Mean | 89.1% | 91.5% |
| Median | 93.0% | 92.6% |
| Interquartile 25% (IQ1) | 84.2% | 89.1% |
| Interquartile 75% (IQ3) | 96.4% | 95.7% |
| Interquartile Range (IQR) | 12.2% | 6.6% |
| Standard Deviation (Sample) | 10.6% | 6.1% |
| Standard Deviation (Population) | 10.5% | 6.1% |
Demographics Similar to Aleuts and Immigrants from Korea by High School Diploma
In terms of high school diploma, the demographic groups most similar to Aleuts are Immigrants from Norway (90.5%, a difference of 0.010%), Immigrants from Romania (90.4%, a difference of 0.020%), Immigrants from North Macedonia (90.5%, a difference of 0.030%), Immigrants from Croatia (90.4%, a difference of 0.030%), and Immigrants from Europe (90.5%, a difference of 0.040%). Similarly, the demographic groups most similar to Immigrants from Korea are Immigrants from Kuwait (90.5%, a difference of 0.0%), Immigrants from Europe (90.5%, a difference of 0.020%), Immigrants from Serbia (90.5%, a difference of 0.030%), Immigrants from North Macedonia (90.5%, a difference of 0.030%), and Immigrants from Israel (90.5%, a difference of 0.040%).
| Demographics | Rating | Rank | High School Diploma |
| Celtics | 98.7 /100 | #90 | Exceptional 90.6% |
| South Africans | 98.6 /100 | #91 | Exceptional 90.6% |
| Swiss | 98.6 /100 | #92 | Exceptional 90.6% |
| Immigrants | Western Europe | 98.6 /100 | #93 | Exceptional 90.6% |
| Immigrants | Israel | 98.5 /100 | #94 | Exceptional 90.5% |
| Icelanders | 98.5 /100 | #95 | Exceptional 90.5% |
| Immigrants | Serbia | 98.4 /100 | #96 | Exceptional 90.5% |
| Immigrants | Kuwait | 98.3 /100 | #97 | Exceptional 90.5% |
| Immigrants | Korea | 98.3 /100 | #98 | Exceptional 90.5% |
| Immigrants | Europe | 98.2 /100 | #99 | Exceptional 90.5% |
| Immigrants | North Macedonia | 98.1 /100 | #100 | Exceptional 90.5% |
| Immigrants | Norway | 98.0 /100 | #101 | Exceptional 90.5% |
| Aleuts | 98.0 /100 | #102 | Exceptional 90.4% |
| Immigrants | Romania | 97.8 /100 | #103 | Exceptional 90.4% |
| Immigrants | Croatia | 97.8 /100 | #104 | Exceptional 90.4% |
| Lebanese | 97.4 /100 | #105 | Exceptional 90.4% |
| Syrians | 97.0 /100 | #106 | Exceptional 90.3% |
| Immigrants | Russia | 96.9 /100 | #107 | Exceptional 90.3% |
| Palestinians | 96.7 /100 | #108 | Exceptional 90.3% |
| Immigrants | Zimbabwe | 96.7 /100 | #109 | Exceptional 90.3% |
| Immigrants | Greece | 96.6 /100 | #110 | Exceptional 90.3% |