Barbadian vs Immigrants from Korea Poverty
COMPARE
Barbadian
Immigrants from Korea
Poverty
Poverty Comparison
Barbadians
Immigrants from Korea
14.8%
POVERTY
0.0/ 100
METRIC RATING
274th/ 347
METRIC RANK
10.7%
POVERTY
99.5/ 100
METRIC RATING
28th/ 347
METRIC RANK
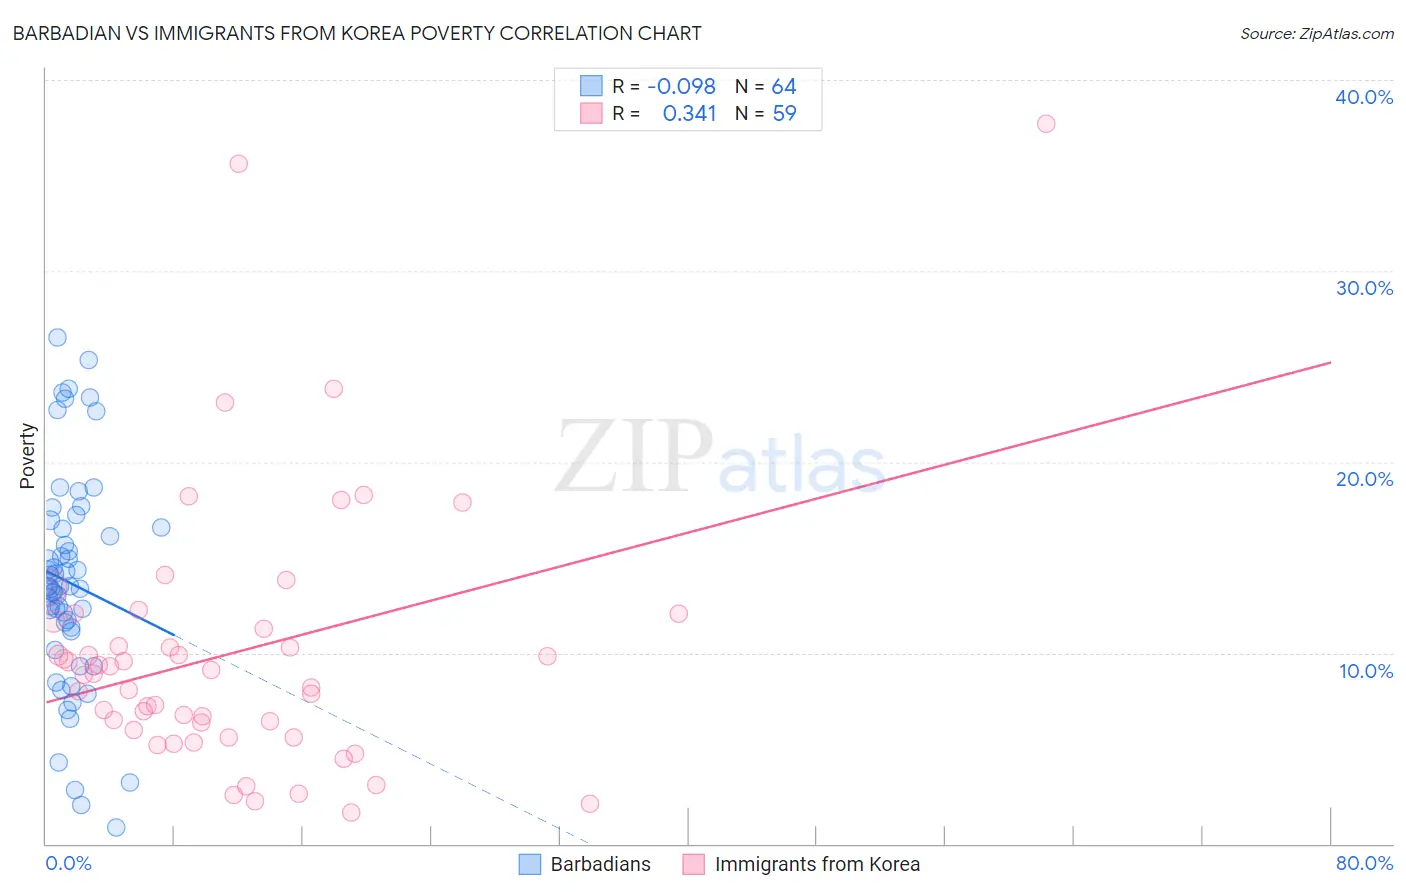
Barbadian vs Immigrants from Korea Poverty Correlation Chart
The statistical analysis conducted on geographies consisting of 141,278,644 people shows a slight negative correlation between the proportion of Barbadians and poverty level in the United States with a correlation coefficient (R) of -0.098 and weighted average of 14.8%. Similarly, the statistical analysis conducted on geographies consisting of 415,974,452 people shows a mild positive correlation between the proportion of Immigrants from Korea and poverty level in the United States with a correlation coefficient (R) of 0.341 and weighted average of 10.7%, a difference of 38.2%.
Poverty Correlation Summary
| Measurement | Barbadian | Immigrants from Korea |
| Minimum | 0.88% | 1.6% |
| Maximum | 26.5% | 37.7% |
| Range | 25.6% | 36.1% |
| Mean | 13.7% | 10.0% |
| Median | 13.5% | 8.9% |
| Interquartile 25% (IQ1) | 11.2% | 5.9% |
| Interquartile 75% (IQ3) | 16.5% | 11.7% |
| Interquartile Range (IQR) | 5.3% | 5.7% |
| Standard Deviation (Sample) | 5.6% | 7.0% |
| Standard Deviation (Population) | 5.6% | 6.9% |
Similar Demographics by Poverty
Demographics Similar to Barbadians by Poverty
In terms of poverty, the demographic groups most similar to Barbadians are Immigrants from West Indies (14.8%, a difference of 0.040%), Immigrants from Bahamas (14.8%, a difference of 0.040%), Bangladeshi (14.8%, a difference of 0.090%), Belizean (14.8%, a difference of 0.11%), and Spanish American (14.7%, a difference of 0.39%).
| Demographics | Rating | Rank | Poverty |
| Iroquois | 0.1 /100 | #267 | Tragic 14.5% |
| Sub-Saharan Africans | 0.1 /100 | #268 | Tragic 14.5% |
| Immigrants | Cuba | 0.1 /100 | #269 | Tragic 14.6% |
| Central Americans | 0.1 /100 | #270 | Tragic 14.6% |
| Shoshone | 0.0 /100 | #271 | Tragic 14.7% |
| Chickasaw | 0.0 /100 | #272 | Tragic 14.7% |
| Spanish Americans | 0.0 /100 | #273 | Tragic 14.7% |
| Barbadians | 0.0 /100 | #274 | Tragic 14.8% |
| Immigrants | West Indies | 0.0 /100 | #275 | Tragic 14.8% |
| Immigrants | Bahamas | 0.0 /100 | #276 | Tragic 14.8% |
| Bangladeshis | 0.0 /100 | #277 | Tragic 14.8% |
| Belizeans | 0.0 /100 | #278 | Tragic 14.8% |
| Immigrants | St. Vincent and the Grenadines | 0.0 /100 | #279 | Tragic 14.9% |
| Haitians | 0.0 /100 | #280 | Tragic 14.9% |
| Immigrants | Barbados | 0.0 /100 | #281 | Tragic 14.9% |
Demographics Similar to Immigrants from Korea by Poverty
In terms of poverty, the demographic groups most similar to Immigrants from Korea are Immigrants from Northern Europe (10.7%, a difference of 0.070%), Greek (10.7%, a difference of 0.090%), Danish (10.7%, a difference of 0.10%), Polish (10.7%, a difference of 0.19%), and Iranian (10.7%, a difference of 0.27%).
| Demographics | Rating | Rank | Poverty |
| Luxembourgers | 99.7 /100 | #21 | Exceptional 10.6% |
| Eastern Europeans | 99.7 /100 | #22 | Exceptional 10.6% |
| Swedes | 99.7 /100 | #23 | Exceptional 10.6% |
| Italians | 99.7 /100 | #24 | Exceptional 10.6% |
| Croatians | 99.6 /100 | #25 | Exceptional 10.6% |
| Burmese | 99.6 /100 | #26 | Exceptional 10.7% |
| Immigrants | Northern Europe | 99.6 /100 | #27 | Exceptional 10.7% |
| Immigrants | Korea | 99.5 /100 | #28 | Exceptional 10.7% |
| Greeks | 99.5 /100 | #29 | Exceptional 10.7% |
| Danes | 99.5 /100 | #30 | Exceptional 10.7% |
| Poles | 99.5 /100 | #31 | Exceptional 10.7% |
| Iranians | 99.5 /100 | #32 | Exceptional 10.7% |
| Macedonians | 99.4 /100 | #33 | Exceptional 10.8% |
| Immigrants | Poland | 99.4 /100 | #34 | Exceptional 10.8% |
| Tongans | 99.4 /100 | #35 | Exceptional 10.8% |