U.S. Virgin Islander vs Immigrants from Korea Poverty
COMPARE
U.S. Virgin Islander
Immigrants from Korea
Poverty
Poverty Comparison
U.S. Virgin Islanders
Immigrants from Korea
16.1%
POVERTY
0.0/ 100
METRIC RATING
317th/ 347
METRIC RANK
10.7%
POVERTY
99.5/ 100
METRIC RATING
28th/ 347
METRIC RANK
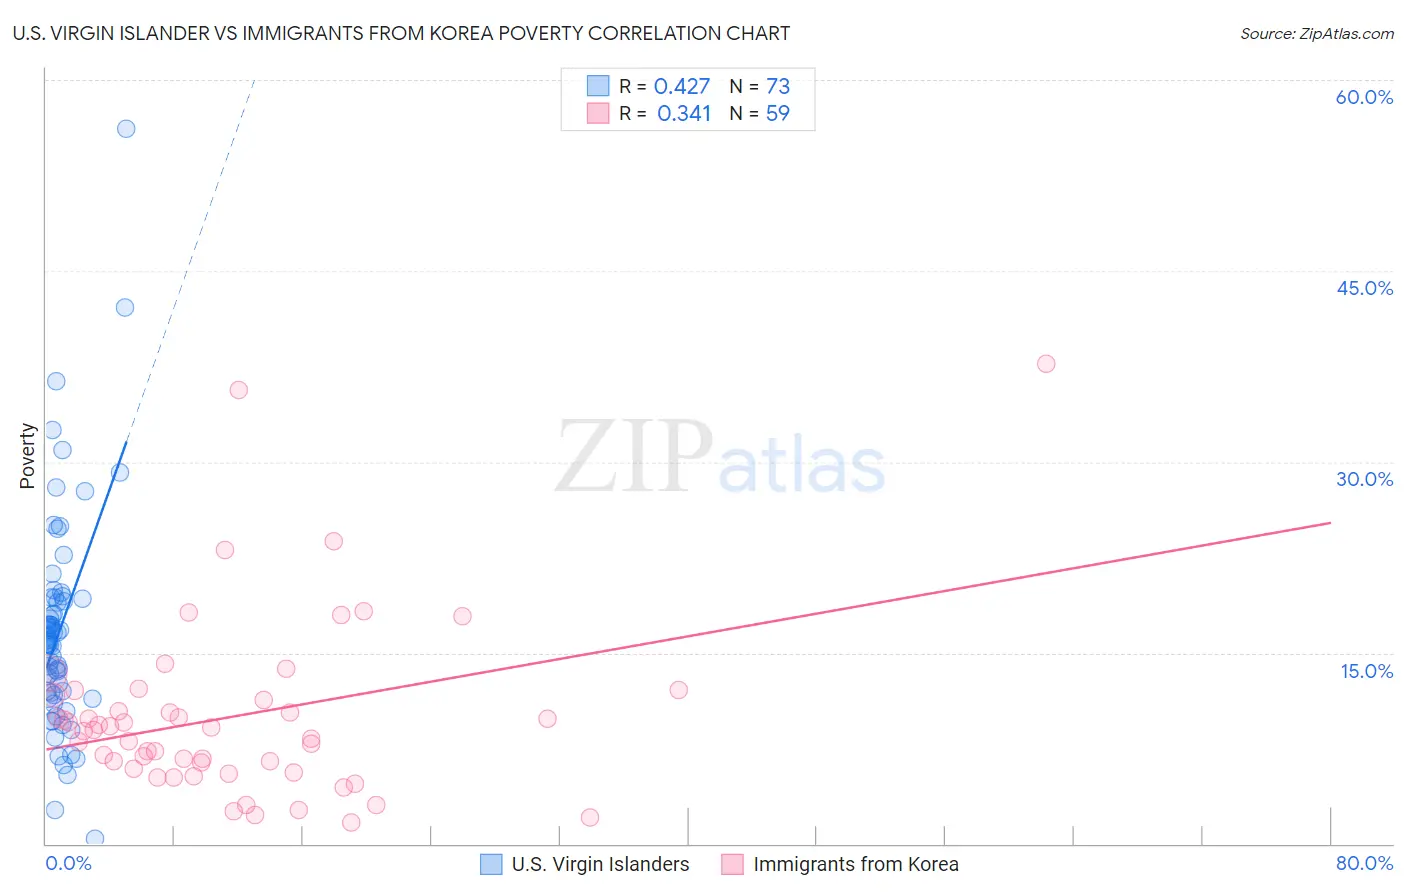
U.S. Virgin Islander vs Immigrants from Korea Poverty Correlation Chart
The statistical analysis conducted on geographies consisting of 87,513,467 people shows a moderate positive correlation between the proportion of U.S. Virgin Islanders and poverty level in the United States with a correlation coefficient (R) of 0.427 and weighted average of 16.1%. Similarly, the statistical analysis conducted on geographies consisting of 415,974,452 people shows a mild positive correlation between the proportion of Immigrants from Korea and poverty level in the United States with a correlation coefficient (R) of 0.341 and weighted average of 10.7%, a difference of 49.8%.
Poverty Correlation Summary
| Measurement | U.S. Virgin Islander | Immigrants from Korea |
| Minimum | 0.43% | 1.6% |
| Maximum | 56.2% | 37.7% |
| Range | 55.8% | 36.1% |
| Mean | 16.8% | 10.0% |
| Median | 16.0% | 8.9% |
| Interquartile 25% (IQ1) | 11.8% | 5.9% |
| Interquartile 75% (IQ3) | 19.3% | 11.7% |
| Interquartile Range (IQR) | 7.5% | 5.7% |
| Standard Deviation (Sample) | 8.7% | 7.0% |
| Standard Deviation (Population) | 8.6% | 6.9% |
Similar Demographics by Poverty
Demographics Similar to U.S. Virgin Islanders by Poverty
In terms of poverty, the demographic groups most similar to U.S. Virgin Islanders are Immigrants from Dominica (16.1%, a difference of 0.29%), Immigrants from Congo (16.1%, a difference of 0.49%), Immigrants from Honduras (16.2%, a difference of 0.72%), British West Indian (15.9%, a difference of 1.3%), and Honduran (15.9%, a difference of 1.3%).
| Demographics | Rating | Rank | Poverty |
| Dutch West Indians | 0.0 /100 | #310 | Tragic 15.6% |
| Chippewa | 0.0 /100 | #311 | Tragic 15.7% |
| Cajuns | 0.0 /100 | #312 | Tragic 15.7% |
| Immigrants | Grenada | 0.0 /100 | #313 | Tragic 15.8% |
| Immigrants | Somalia | 0.0 /100 | #314 | Tragic 15.8% |
| British West Indians | 0.0 /100 | #315 | Tragic 15.9% |
| Hondurans | 0.0 /100 | #316 | Tragic 15.9% |
| U.S. Virgin Islanders | 0.0 /100 | #317 | Tragic 16.1% |
| Immigrants | Dominica | 0.0 /100 | #318 | Tragic 16.1% |
| Immigrants | Congo | 0.0 /100 | #319 | Tragic 16.1% |
| Immigrants | Honduras | 0.0 /100 | #320 | Tragic 16.2% |
| Arapaho | 0.0 /100 | #321 | Tragic 16.3% |
| Menominee | 0.0 /100 | #322 | Tragic 16.4% |
| Colville | 0.0 /100 | #323 | Tragic 16.6% |
| Yakama | 0.0 /100 | #324 | Tragic 16.7% |
Demographics Similar to Immigrants from Korea by Poverty
In terms of poverty, the demographic groups most similar to Immigrants from Korea are Immigrants from Northern Europe (10.7%, a difference of 0.070%), Greek (10.7%, a difference of 0.090%), Danish (10.7%, a difference of 0.10%), Polish (10.7%, a difference of 0.19%), and Iranian (10.7%, a difference of 0.27%).
| Demographics | Rating | Rank | Poverty |
| Luxembourgers | 99.7 /100 | #21 | Exceptional 10.6% |
| Eastern Europeans | 99.7 /100 | #22 | Exceptional 10.6% |
| Swedes | 99.7 /100 | #23 | Exceptional 10.6% |
| Italians | 99.7 /100 | #24 | Exceptional 10.6% |
| Croatians | 99.6 /100 | #25 | Exceptional 10.6% |
| Burmese | 99.6 /100 | #26 | Exceptional 10.7% |
| Immigrants | Northern Europe | 99.6 /100 | #27 | Exceptional 10.7% |
| Immigrants | Korea | 99.5 /100 | #28 | Exceptional 10.7% |
| Greeks | 99.5 /100 | #29 | Exceptional 10.7% |
| Danes | 99.5 /100 | #30 | Exceptional 10.7% |
| Poles | 99.5 /100 | #31 | Exceptional 10.7% |
| Iranians | 99.5 /100 | #32 | Exceptional 10.7% |
| Macedonians | 99.4 /100 | #33 | Exceptional 10.8% |
| Immigrants | Poland | 99.4 /100 | #34 | Exceptional 10.8% |
| Tongans | 99.4 /100 | #35 | Exceptional 10.8% |