Haitian vs Immigrants from Korea Poverty
COMPARE
Haitian
Immigrants from Korea
Poverty
Poverty Comparison
Haitians
Immigrants from Korea
14.9%
POVERTY
0.0/ 100
METRIC RATING
280th/ 347
METRIC RANK
10.7%
POVERTY
99.5/ 100
METRIC RATING
28th/ 347
METRIC RANK
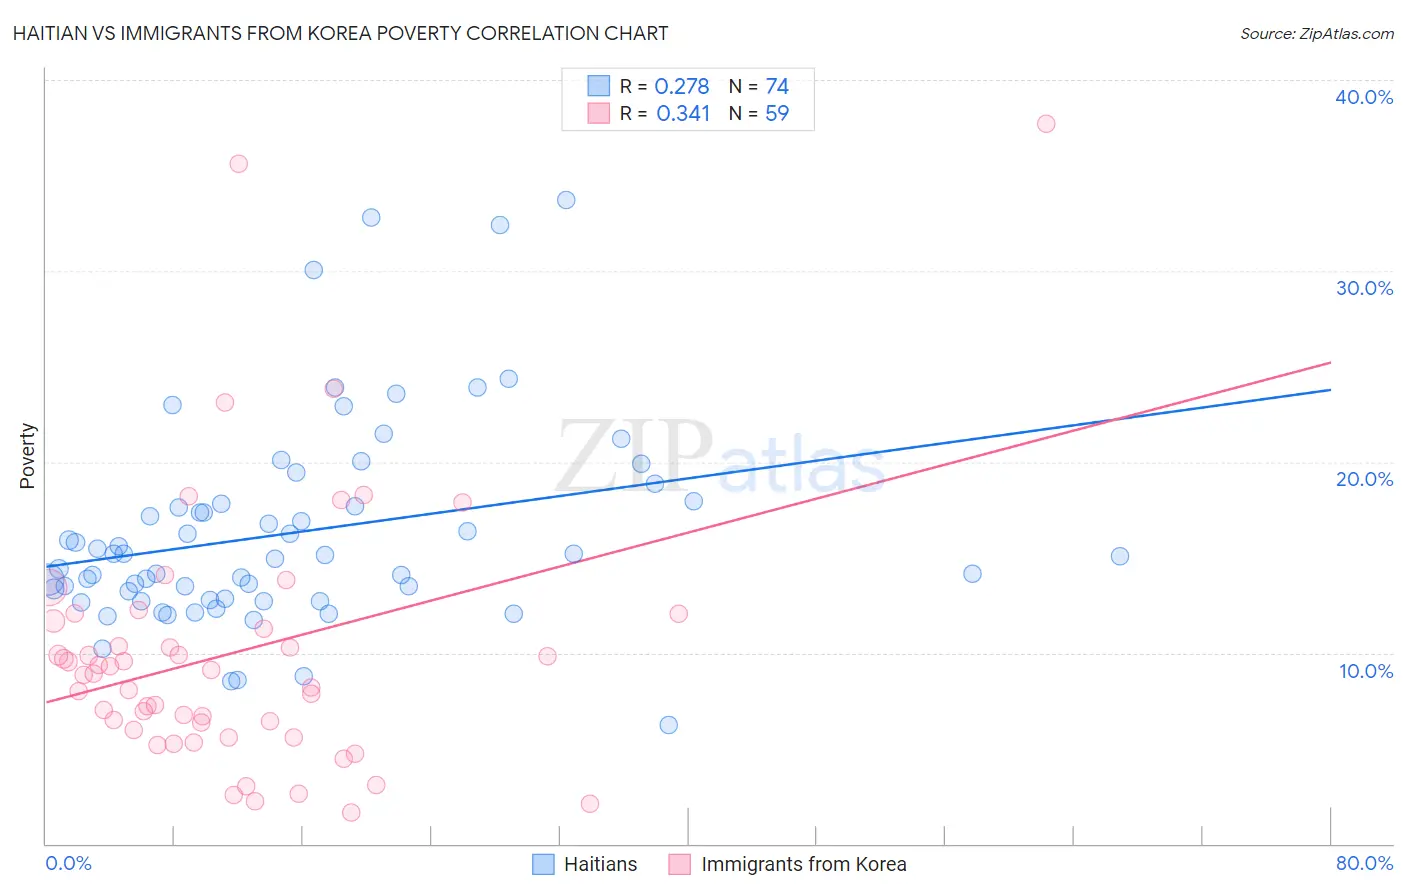
Haitian vs Immigrants from Korea Poverty Correlation Chart
The statistical analysis conducted on geographies consisting of 287,739,300 people shows a weak positive correlation between the proportion of Haitians and poverty level in the United States with a correlation coefficient (R) of 0.278 and weighted average of 14.9%. Similarly, the statistical analysis conducted on geographies consisting of 415,974,452 people shows a mild positive correlation between the proportion of Immigrants from Korea and poverty level in the United States with a correlation coefficient (R) of 0.341 and weighted average of 10.7%, a difference of 39.0%.
Poverty Correlation Summary
| Measurement | Haitian | Immigrants from Korea |
| Minimum | 6.2% | 1.6% |
| Maximum | 33.7% | 37.7% |
| Range | 27.5% | 36.1% |
| Mean | 16.3% | 10.0% |
| Median | 15.1% | 8.9% |
| Interquartile 25% (IQ1) | 12.8% | 5.9% |
| Interquartile 75% (IQ3) | 17.8% | 11.7% |
| Interquartile Range (IQR) | 5.0% | 5.7% |
| Standard Deviation (Sample) | 5.4% | 7.0% |
| Standard Deviation (Population) | 5.4% | 6.9% |
Similar Demographics by Poverty
Demographics Similar to Haitians by Poverty
In terms of poverty, the demographic groups most similar to Haitians are Immigrants from Barbados (14.9%, a difference of 0.070%), Immigrants from St. Vincent and the Grenadines (14.9%, a difference of 0.20%), Comanche (15.0%, a difference of 0.40%), Belizean (14.8%, a difference of 0.49%), and Bangladeshi (14.8%, a difference of 0.51%).
| Demographics | Rating | Rank | Poverty |
| Spanish Americans | 0.0 /100 | #273 | Tragic 14.7% |
| Barbadians | 0.0 /100 | #274 | Tragic 14.8% |
| Immigrants | West Indies | 0.0 /100 | #275 | Tragic 14.8% |
| Immigrants | Bahamas | 0.0 /100 | #276 | Tragic 14.8% |
| Bangladeshis | 0.0 /100 | #277 | Tragic 14.8% |
| Belizeans | 0.0 /100 | #278 | Tragic 14.8% |
| Immigrants | St. Vincent and the Grenadines | 0.0 /100 | #279 | Tragic 14.9% |
| Haitians | 0.0 /100 | #280 | Tragic 14.9% |
| Immigrants | Barbados | 0.0 /100 | #281 | Tragic 14.9% |
| Comanche | 0.0 /100 | #282 | Tragic 15.0% |
| Immigrants | Haiti | 0.0 /100 | #283 | Tragic 15.0% |
| West Indians | 0.0 /100 | #284 | Tragic 15.0% |
| Vietnamese | 0.0 /100 | #285 | Tragic 15.0% |
| Immigrants | Latin America | 0.0 /100 | #286 | Tragic 15.0% |
| Inupiat | 0.0 /100 | #287 | Tragic 15.1% |
Demographics Similar to Immigrants from Korea by Poverty
In terms of poverty, the demographic groups most similar to Immigrants from Korea are Immigrants from Northern Europe (10.7%, a difference of 0.070%), Greek (10.7%, a difference of 0.090%), Danish (10.7%, a difference of 0.10%), Polish (10.7%, a difference of 0.19%), and Iranian (10.7%, a difference of 0.27%).
| Demographics | Rating | Rank | Poverty |
| Luxembourgers | 99.7 /100 | #21 | Exceptional 10.6% |
| Eastern Europeans | 99.7 /100 | #22 | Exceptional 10.6% |
| Swedes | 99.7 /100 | #23 | Exceptional 10.6% |
| Italians | 99.7 /100 | #24 | Exceptional 10.6% |
| Croatians | 99.6 /100 | #25 | Exceptional 10.6% |
| Burmese | 99.6 /100 | #26 | Exceptional 10.7% |
| Immigrants | Northern Europe | 99.6 /100 | #27 | Exceptional 10.7% |
| Immigrants | Korea | 99.5 /100 | #28 | Exceptional 10.7% |
| Greeks | 99.5 /100 | #29 | Exceptional 10.7% |
| Danes | 99.5 /100 | #30 | Exceptional 10.7% |
| Poles | 99.5 /100 | #31 | Exceptional 10.7% |
| Iranians | 99.5 /100 | #32 | Exceptional 10.7% |
| Macedonians | 99.4 /100 | #33 | Exceptional 10.8% |
| Immigrants | Poland | 99.4 /100 | #34 | Exceptional 10.8% |
| Tongans | 99.4 /100 | #35 | Exceptional 10.8% |