Chilean vs Immigrants from Korea Poverty
COMPARE
Chilean
Immigrants from Korea
Poverty
Poverty Comparison
Chileans
Immigrants from Korea
11.8%
POVERTY
84.2/ 100
METRIC RATING
136th/ 347
METRIC RANK
10.7%
POVERTY
99.5/ 100
METRIC RATING
28th/ 347
METRIC RANK
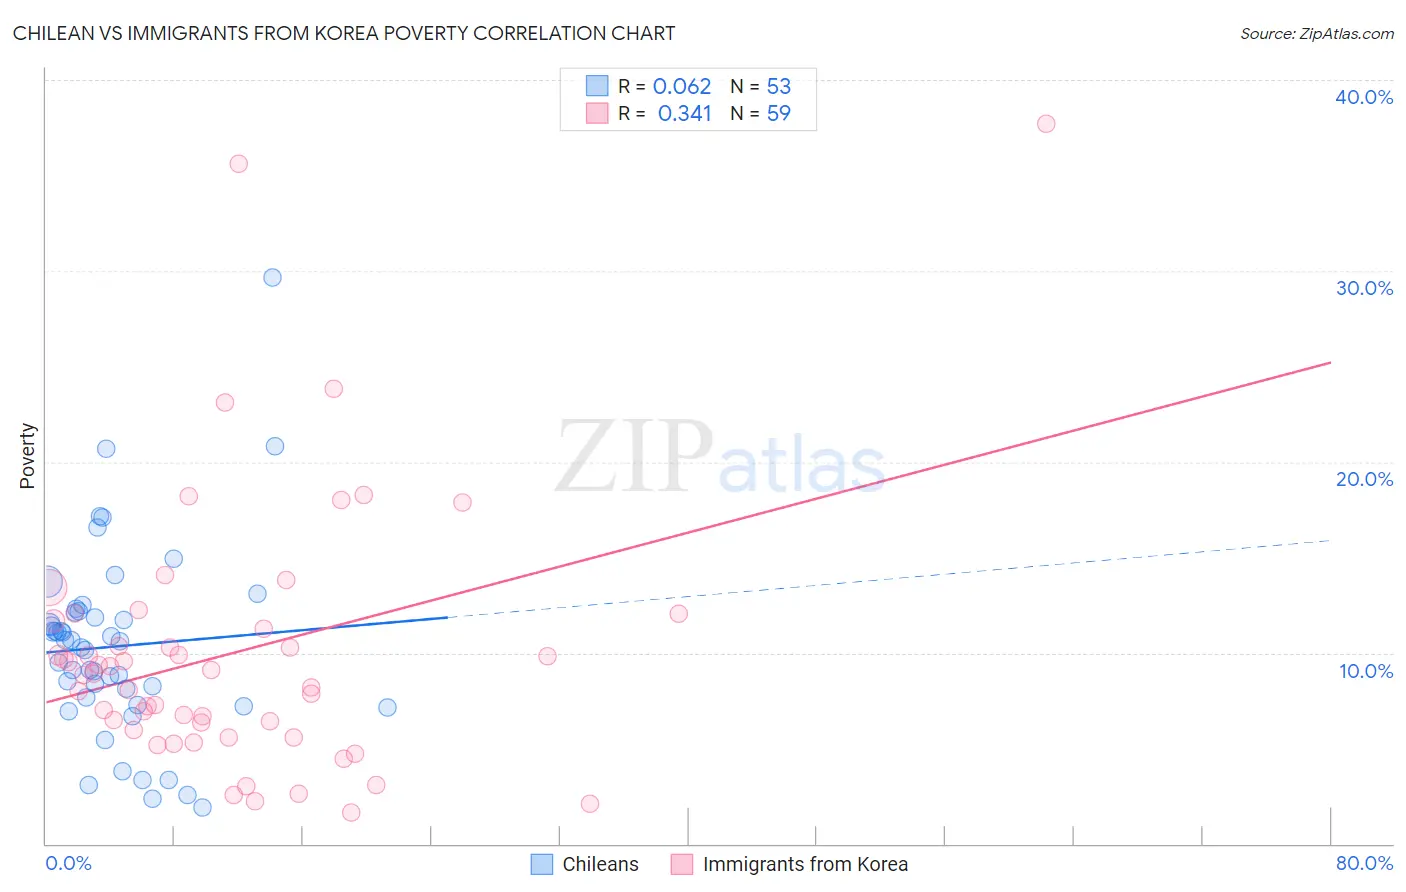
Chilean vs Immigrants from Korea Poverty Correlation Chart
The statistical analysis conducted on geographies consisting of 256,580,078 people shows a slight positive correlation between the proportion of Chileans and poverty level in the United States with a correlation coefficient (R) of 0.062 and weighted average of 11.8%. Similarly, the statistical analysis conducted on geographies consisting of 415,974,452 people shows a mild positive correlation between the proportion of Immigrants from Korea and poverty level in the United States with a correlation coefficient (R) of 0.341 and weighted average of 10.7%, a difference of 10.3%.
Poverty Correlation Summary
| Measurement | Chilean | Immigrants from Korea |
| Minimum | 1.9% | 1.6% |
| Maximum | 29.7% | 37.7% |
| Range | 27.8% | 36.1% |
| Mean | 10.3% | 10.0% |
| Median | 10.6% | 8.9% |
| Interquartile 25% (IQ1) | 7.5% | 5.9% |
| Interquartile 75% (IQ3) | 12.1% | 11.7% |
| Interquartile Range (IQR) | 4.7% | 5.7% |
| Standard Deviation (Sample) | 5.0% | 7.0% |
| Standard Deviation (Population) | 5.0% | 6.9% |
Similar Demographics by Poverty
Demographics Similar to Chileans by Poverty
In terms of poverty, the demographic groups most similar to Chileans are Immigrants from Vietnam (11.8%, a difference of 0.19%), Yugoslavian (11.8%, a difference of 0.20%), Immigrants from Western Europe (11.8%, a difference of 0.21%), Immigrants from Switzerland (11.8%, a difference of 0.21%), and Peruvian (11.8%, a difference of 0.29%).
| Demographics | Rating | Rank | Poverty |
| South Africans | 87.0 /100 | #129 | Excellent 11.7% |
| Immigrants | Ukraine | 86.6 /100 | #130 | Excellent 11.8% |
| French | 86.1 /100 | #131 | Excellent 11.8% |
| Peruvians | 85.6 /100 | #132 | Excellent 11.8% |
| Immigrants | Western Europe | 85.2 /100 | #133 | Excellent 11.8% |
| Yugoslavians | 85.2 /100 | #134 | Excellent 11.8% |
| Immigrants | Vietnam | 85.2 /100 | #135 | Excellent 11.8% |
| Chileans | 84.2 /100 | #136 | Excellent 11.8% |
| Immigrants | Switzerland | 83.0 /100 | #137 | Excellent 11.8% |
| Immigrants | Jordan | 82.4 /100 | #138 | Excellent 11.9% |
| Pakistanis | 82.2 /100 | #139 | Excellent 11.9% |
| Immigrants | Peru | 81.1 /100 | #140 | Excellent 11.9% |
| Immigrants | France | 80.5 /100 | #141 | Excellent 11.9% |
| Basques | 80.4 /100 | #142 | Excellent 11.9% |
| Brazilians | 79.7 /100 | #143 | Good 11.9% |
Demographics Similar to Immigrants from Korea by Poverty
In terms of poverty, the demographic groups most similar to Immigrants from Korea are Immigrants from Northern Europe (10.7%, a difference of 0.070%), Greek (10.7%, a difference of 0.090%), Danish (10.7%, a difference of 0.10%), Polish (10.7%, a difference of 0.19%), and Iranian (10.7%, a difference of 0.27%).
| Demographics | Rating | Rank | Poverty |
| Luxembourgers | 99.7 /100 | #21 | Exceptional 10.6% |
| Eastern Europeans | 99.7 /100 | #22 | Exceptional 10.6% |
| Swedes | 99.7 /100 | #23 | Exceptional 10.6% |
| Italians | 99.7 /100 | #24 | Exceptional 10.6% |
| Croatians | 99.6 /100 | #25 | Exceptional 10.6% |
| Burmese | 99.6 /100 | #26 | Exceptional 10.7% |
| Immigrants | Northern Europe | 99.6 /100 | #27 | Exceptional 10.7% |
| Immigrants | Korea | 99.5 /100 | #28 | Exceptional 10.7% |
| Greeks | 99.5 /100 | #29 | Exceptional 10.7% |
| Danes | 99.5 /100 | #30 | Exceptional 10.7% |
| Poles | 99.5 /100 | #31 | Exceptional 10.7% |
| Iranians | 99.5 /100 | #32 | Exceptional 10.7% |
| Macedonians | 99.4 /100 | #33 | Exceptional 10.8% |
| Immigrants | Poland | 99.4 /100 | #34 | Exceptional 10.8% |
| Tongans | 99.4 /100 | #35 | Exceptional 10.8% |