Aleut vs Guamanian/Chamorro Unemployment Among Youth under 25 years
COMPARE
Aleut
Guamanian/Chamorro
Unemployment Among Youth under 25 years
Unemployment Among Youth under 25 years Comparison
Aleuts
Guamanians/Chamorros
14.1%
UNEMPLOYMENT AMONG YOUTH UNDER 25 YEARS
0.0/ 100
METRIC RATING
309th/ 347
METRIC RANK
11.9%
UNEMPLOYMENT AMONG YOUTH UNDER 25 YEARS
7.0/ 100
METRIC RATING
216th/ 347
METRIC RANK
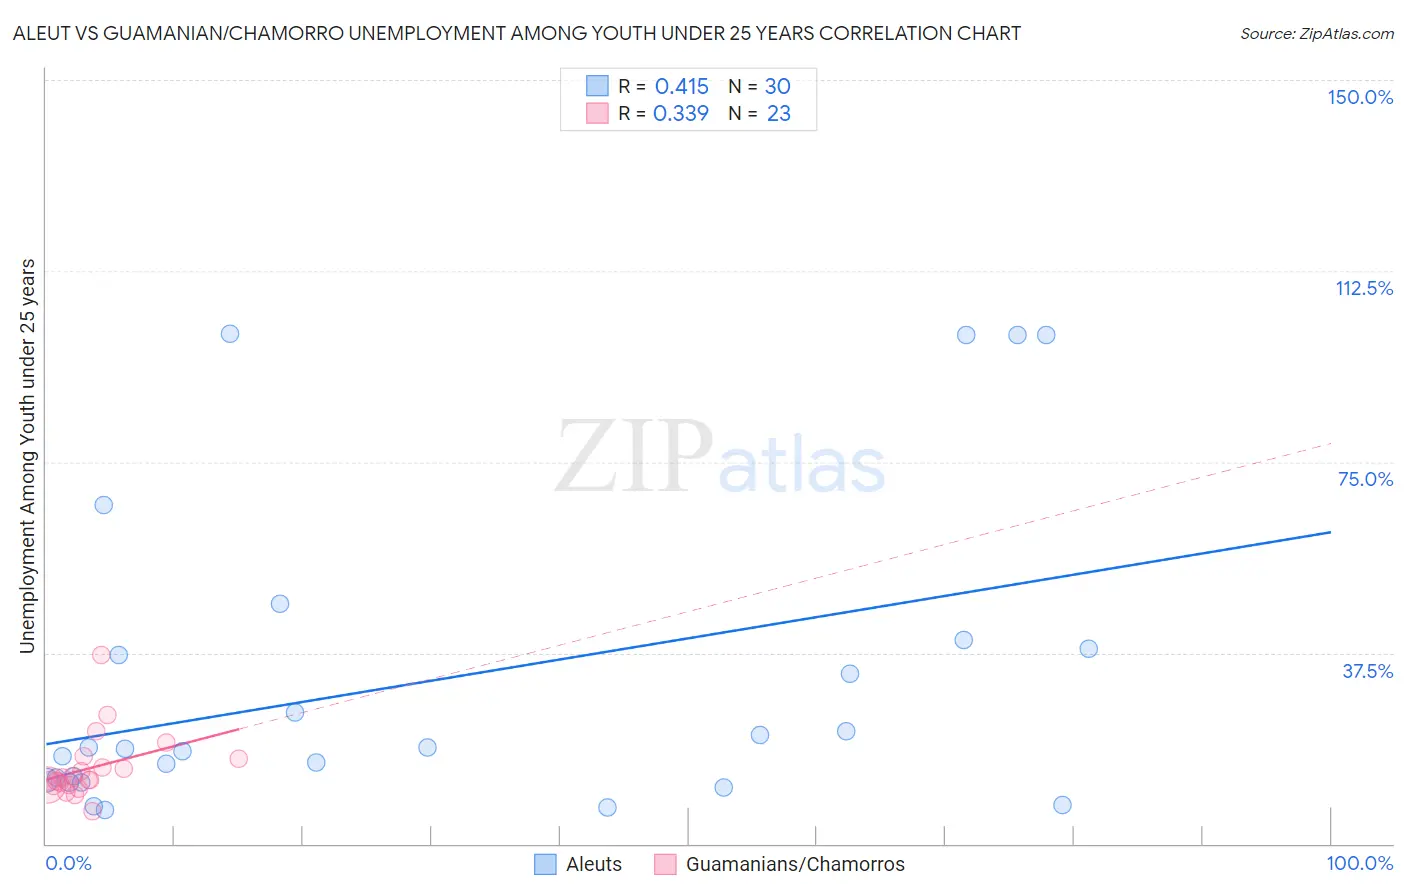
Aleut vs Guamanian/Chamorro Unemployment Among Youth under 25 years Correlation Chart
The statistical analysis conducted on geographies consisting of 61,559,478 people shows a moderate positive correlation between the proportion of Aleuts and unemployment rate among youth under the age of 25 in the United States with a correlation coefficient (R) of 0.415 and weighted average of 14.1%. Similarly, the statistical analysis conducted on geographies consisting of 220,678,846 people shows a mild positive correlation between the proportion of Guamanians/Chamorros and unemployment rate among youth under the age of 25 in the United States with a correlation coefficient (R) of 0.339 and weighted average of 11.9%, a difference of 18.6%.
Unemployment Among Youth under 25 years Correlation Summary
| Measurement | Aleut | Guamanian/Chamorro |
| Minimum | 6.6% | 6.4% |
| Maximum | 100.1% | 37.0% |
| Range | 93.5% | 30.6% |
| Mean | 31.9% | 14.8% |
| Median | 18.8% | 12.6% |
| Interquartile 25% (IQ1) | 12.4% | 11.6% |
| Interquartile 75% (IQ3) | 38.4% | 16.6% |
| Interquartile Range (IQR) | 26.0% | 5.0% |
| Standard Deviation (Sample) | 30.3% | 6.4% |
| Standard Deviation (Population) | 29.8% | 6.2% |
Similar Demographics by Unemployment Among Youth under 25 years
Demographics Similar to Aleuts by Unemployment Among Youth under 25 years
In terms of unemployment among youth under 25 years, the demographic groups most similar to Aleuts are Immigrants from West Indies (14.2%, a difference of 0.54%), Immigrants from Bangladesh (14.2%, a difference of 0.57%), Immigrants from Belize (14.0%, a difference of 0.86%), Vietnamese (14.3%, a difference of 0.89%), and Immigrants from Haiti (14.0%, a difference of 1.3%).
| Demographics | Rating | Rank | Unemployment Among Youth under 25 years |
| Immigrants | Sierra Leone | 0.0 /100 | #302 | Tragic 13.8% |
| Belizeans | 0.0 /100 | #303 | Tragic 13.8% |
| Houma | 0.0 /100 | #304 | Tragic 13.8% |
| Haitians | 0.0 /100 | #305 | Tragic 13.9% |
| Pueblo | 0.0 /100 | #306 | Tragic 13.9% |
| Immigrants | Haiti | 0.0 /100 | #307 | Tragic 14.0% |
| Immigrants | Belize | 0.0 /100 | #308 | Tragic 14.0% |
| Aleuts | 0.0 /100 | #309 | Tragic 14.1% |
| Immigrants | West Indies | 0.0 /100 | #310 | Tragic 14.2% |
| Immigrants | Bangladesh | 0.0 /100 | #311 | Tragic 14.2% |
| Vietnamese | 0.0 /100 | #312 | Tragic 14.3% |
| Immigrants | Armenia | 0.0 /100 | #313 | Tragic 14.4% |
| Jamaicans | 0.0 /100 | #314 | Tragic 14.4% |
| Sioux | 0.0 /100 | #315 | Tragic 14.4% |
| Natives/Alaskans | 0.0 /100 | #316 | Tragic 14.5% |
Demographics Similar to Guamanians/Chamorros by Unemployment Among Youth under 25 years
In terms of unemployment among youth under 25 years, the demographic groups most similar to Guamanians/Chamorros are Yaqui (11.9%, a difference of 0.010%), Immigrants from Middle Africa (11.9%, a difference of 0.020%), Samoan (11.9%, a difference of 0.060%), Nonimmigrants (11.9%, a difference of 0.13%), and Alsatian (11.9%, a difference of 0.15%).
| Demographics | Rating | Rank | Unemployment Among Youth under 25 years |
| Immigrants | Lebanon | 11.3 /100 | #209 | Poor 11.8% |
| Assyrians/Chaldeans/Syriacs | 9.8 /100 | #210 | Tragic 11.9% |
| Immigrants | Philippines | 9.2 /100 | #211 | Tragic 11.9% |
| Colombians | 9.1 /100 | #212 | Tragic 11.9% |
| South Americans | 8.5 /100 | #213 | Tragic 11.9% |
| Costa Ricans | 8.2 /100 | #214 | Tragic 11.9% |
| Samoans | 7.4 /100 | #215 | Tragic 11.9% |
| Guamanians/Chamorros | 7.0 /100 | #216 | Tragic 11.9% |
| Yaqui | 6.9 /100 | #217 | Tragic 11.9% |
| Immigrants | Middle Africa | 6.8 /100 | #218 | Tragic 11.9% |
| Immigrants | Nonimmigrants | 6.2 /100 | #219 | Tragic 11.9% |
| Alsatians | 6.1 /100 | #220 | Tragic 11.9% |
| Immigrants | Portugal | 4.9 /100 | #221 | Tragic 12.0% |
| Israelis | 4.1 /100 | #222 | Tragic 12.0% |
| Immigrants | Ireland | 3.5 /100 | #223 | Tragic 12.0% |