Albanian vs Immigrants from Sudan Family Poverty
COMPARE
Albanian
Immigrants from Sudan
Family Poverty
Family Poverty Comparison
Albanians
Immigrants from Sudan
8.5%
FAMILY POVERTY
83.3/ 100
METRIC RATING
144th/ 347
METRIC RANK
10.1%
FAMILY POVERTY
2.3/ 100
METRIC RATING
232nd/ 347
METRIC RANK
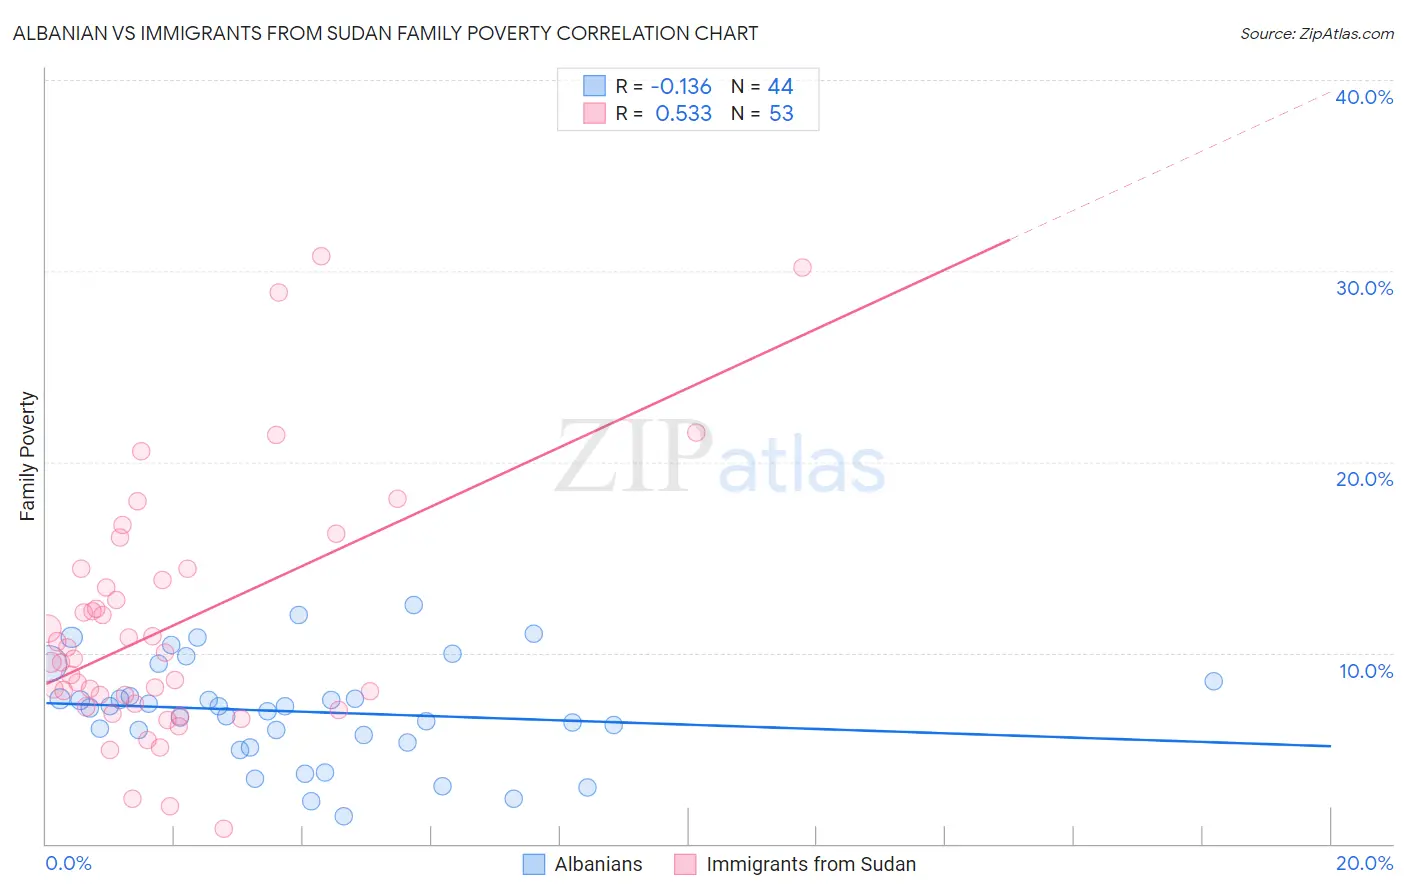
Albanian vs Immigrants from Sudan Family Poverty Correlation Chart
The statistical analysis conducted on geographies consisting of 192,873,103 people shows a poor negative correlation between the proportion of Albanians and poverty level among families in the United States with a correlation coefficient (R) of -0.136 and weighted average of 8.5%. Similarly, the statistical analysis conducted on geographies consisting of 118,923,711 people shows a substantial positive correlation between the proportion of Immigrants from Sudan and poverty level among families in the United States with a correlation coefficient (R) of 0.533 and weighted average of 10.1%, a difference of 18.4%.
Family Poverty Correlation Summary
| Measurement | Albanian | Immigrants from Sudan |
| Minimum | 1.4% | 0.80% |
| Maximum | 12.5% | 30.8% |
| Range | 11.1% | 30.0% |
| Mean | 6.9% | 11.4% |
| Median | 7.1% | 9.7% |
| Interquartile 25% (IQ1) | 5.5% | 7.3% |
| Interquartile 75% (IQ3) | 8.1% | 14.1% |
| Interquartile Range (IQR) | 2.6% | 6.9% |
| Standard Deviation (Sample) | 2.7% | 6.5% |
| Standard Deviation (Population) | 2.6% | 6.4% |
Similar Demographics by Family Poverty
Demographics Similar to Albanians by Family Poverty
In terms of family poverty, the demographic groups most similar to Albanians are Immigrants from Germany (8.5%, a difference of 0.020%), Immigrants from South Eastern Asia (8.5%, a difference of 0.020%), Immigrants from Belarus (8.5%, a difference of 0.030%), Yugoslavian (8.5%, a difference of 0.050%), and Immigrants from Jordan (8.5%, a difference of 0.060%).
| Demographics | Rating | Rank | Family Poverty |
| Immigrants | Southern Europe | 86.0 /100 | #137 | Excellent 8.5% |
| Armenians | 84.6 /100 | #138 | Excellent 8.5% |
| Immigrants | Nepal | 84.2 /100 | #139 | Excellent 8.5% |
| Immigrants | Kazakhstan | 84.1 /100 | #140 | Excellent 8.5% |
| Immigrants | Ukraine | 83.9 /100 | #141 | Excellent 8.5% |
| Yugoslavians | 83.5 /100 | #142 | Excellent 8.5% |
| Immigrants | Germany | 83.3 /100 | #143 | Excellent 8.5% |
| Albanians | 83.3 /100 | #144 | Excellent 8.5% |
| Immigrants | South Eastern Asia | 83.2 /100 | #145 | Excellent 8.5% |
| Immigrants | Belarus | 83.2 /100 | #146 | Excellent 8.5% |
| Immigrants | Jordan | 83.0 /100 | #147 | Excellent 8.5% |
| Scotch-Irish | 82.2 /100 | #148 | Excellent 8.6% |
| Mongolians | 80.4 /100 | #149 | Excellent 8.6% |
| Syrians | 80.3 /100 | #150 | Excellent 8.6% |
| Brazilians | 80.1 /100 | #151 | Excellent 8.6% |
Demographics Similar to Immigrants from Sudan by Family Poverty
In terms of family poverty, the demographic groups most similar to Immigrants from Sudan are Fijian (10.1%, a difference of 0.25%), Immigrants from Middle Africa (10.1%, a difference of 0.36%), Nigerian (10.1%, a difference of 0.39%), Alaskan Athabascan (10.1%, a difference of 0.43%), and Immigrants from Nigeria (10.2%, a difference of 0.64%).
| Demographics | Rating | Rank | Family Poverty |
| Immigrants | Immigrants | 3.6 /100 | #225 | Tragic 10.0% |
| Ottawa | 3.3 /100 | #226 | Tragic 10.0% |
| Immigrants | Armenia | 3.3 /100 | #227 | Tragic 10.0% |
| Sudanese | 3.1 /100 | #228 | Tragic 10.0% |
| Immigrants | Uzbekistan | 3.1 /100 | #229 | Tragic 10.0% |
| Immigrants | Panama | 3.1 /100 | #230 | Tragic 10.0% |
| Alaskan Athabascans | 2.7 /100 | #231 | Tragic 10.1% |
| Immigrants | Sudan | 2.3 /100 | #232 | Tragic 10.1% |
| Fijians | 2.1 /100 | #233 | Tragic 10.1% |
| Immigrants | Middle Africa | 2.1 /100 | #234 | Tragic 10.1% |
| Nigerians | 2.0 /100 | #235 | Tragic 10.1% |
| Immigrants | Nigeria | 1.9 /100 | #236 | Tragic 10.2% |
| Immigrants | Laos | 1.7 /100 | #237 | Tragic 10.2% |
| French American Indians | 1.5 /100 | #238 | Tragic 10.2% |
| Potawatomi | 1.5 /100 | #239 | Tragic 10.2% |