Spaniard vs Immigrants from Sudan Family Poverty
COMPARE
Spaniard
Immigrants from Sudan
Family Poverty
Family Poverty Comparison
Spaniards
Immigrants from Sudan
9.4%
FAMILY POVERTY
22.8/ 100
METRIC RATING
199th/ 347
METRIC RANK
10.1%
FAMILY POVERTY
2.3/ 100
METRIC RATING
232nd/ 347
METRIC RANK
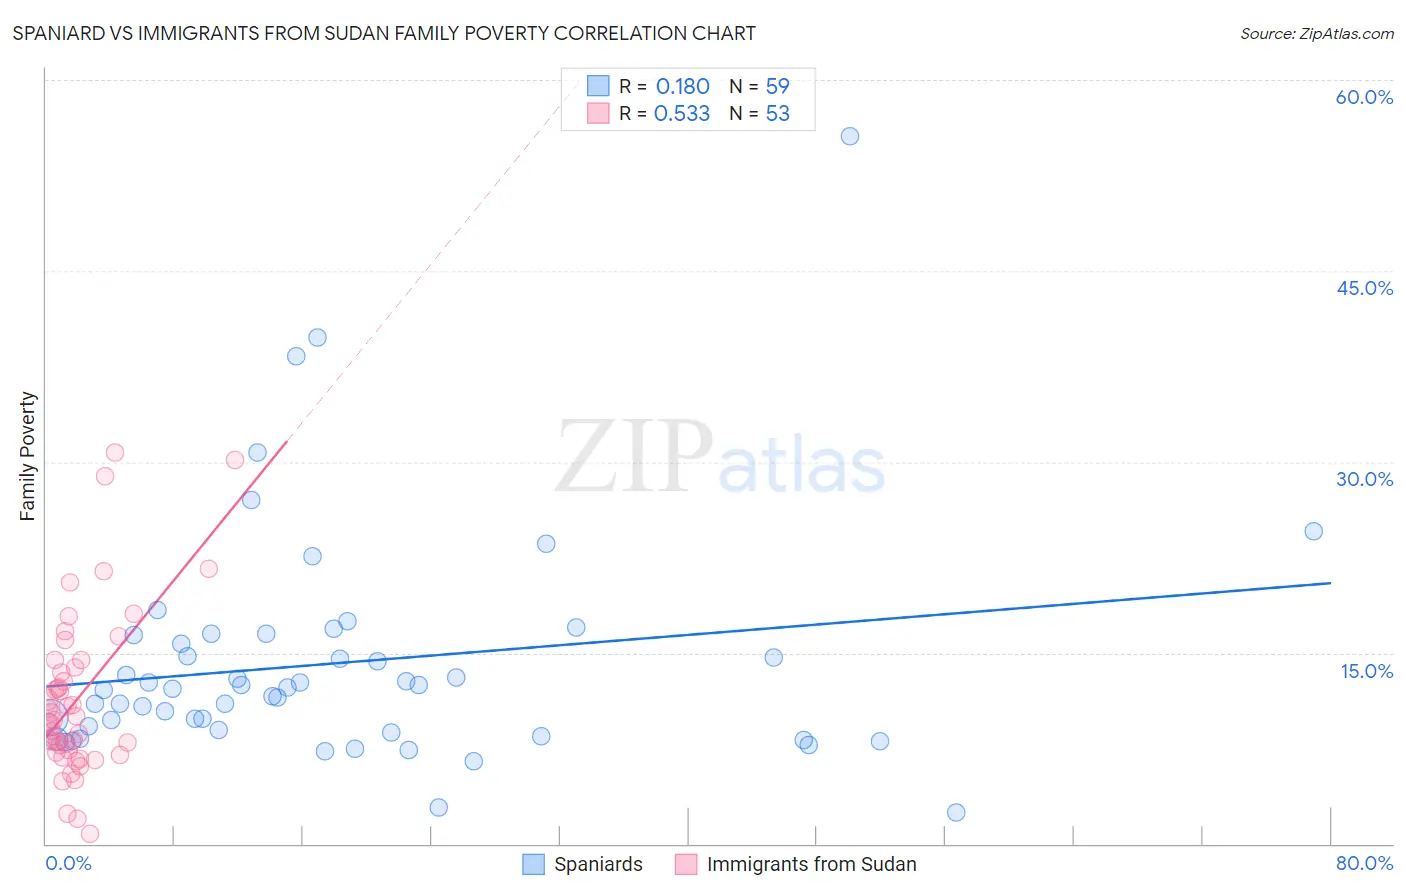
Spaniard vs Immigrants from Sudan Family Poverty Correlation Chart
The statistical analysis conducted on geographies consisting of 441,991,510 people shows a poor positive correlation between the proportion of Spaniards and poverty level among families in the United States with a correlation coefficient (R) of 0.180 and weighted average of 9.4%. Similarly, the statistical analysis conducted on geographies consisting of 118,923,711 people shows a substantial positive correlation between the proportion of Immigrants from Sudan and poverty level among families in the United States with a correlation coefficient (R) of 0.533 and weighted average of 10.1%, a difference of 7.9%.
Family Poverty Correlation Summary
| Measurement | Spaniard | Immigrants from Sudan |
| Minimum | 2.5% | 0.80% |
| Maximum | 55.6% | 30.8% |
| Range | 53.1% | 30.0% |
| Mean | 14.2% | 11.4% |
| Median | 12.2% | 9.7% |
| Interquartile 25% (IQ1) | 8.7% | 7.3% |
| Interquartile 75% (IQ3) | 16.4% | 14.1% |
| Interquartile Range (IQR) | 7.7% | 6.9% |
| Standard Deviation (Sample) | 9.0% | 6.5% |
| Standard Deviation (Population) | 9.0% | 6.4% |
Similar Demographics by Family Poverty
Demographics Similar to Spaniards by Family Poverty
In terms of family poverty, the demographic groups most similar to Spaniards are Immigrants from Costa Rica (9.4%, a difference of 0.19%), Iraqi (9.3%, a difference of 0.25%), Immigrants from Colombia (9.3%, a difference of 0.28%), Immigrants from Portugal (9.4%, a difference of 0.42%), and Immigrants from Venezuela (9.3%, a difference of 0.57%).
| Demographics | Rating | Rank | Family Poverty |
| Spanish | 28.7 /100 | #192 | Fair 9.3% |
| Immigrants | Western Asia | 28.2 /100 | #193 | Fair 9.3% |
| South Americans | 28.1 /100 | #194 | Fair 9.3% |
| Venezuelans | 27.4 /100 | #195 | Fair 9.3% |
| Immigrants | Venezuela | 26.1 /100 | #196 | Fair 9.3% |
| Immigrants | Colombia | 24.4 /100 | #197 | Fair 9.3% |
| Iraqis | 24.2 /100 | #198 | Fair 9.3% |
| Spaniards | 22.8 /100 | #199 | Fair 9.4% |
| Immigrants | Costa Rica | 21.7 /100 | #200 | Fair 9.4% |
| Immigrants | Portugal | 20.5 /100 | #201 | Fair 9.4% |
| Immigrants | Sierra Leone | 19.6 /100 | #202 | Poor 9.4% |
| German Russians | 19.4 /100 | #203 | Poor 9.4% |
| Immigrants | Lebanon | 18.9 /100 | #204 | Poor 9.4% |
| Aleuts | 18.0 /100 | #205 | Poor 9.5% |
| Immigrants | South America | 18.0 /100 | #206 | Poor 9.5% |
Demographics Similar to Immigrants from Sudan by Family Poverty
In terms of family poverty, the demographic groups most similar to Immigrants from Sudan are Fijian (10.1%, a difference of 0.25%), Immigrants from Middle Africa (10.1%, a difference of 0.36%), Nigerian (10.1%, a difference of 0.39%), Alaskan Athabascan (10.1%, a difference of 0.43%), and Immigrants from Nigeria (10.2%, a difference of 0.64%).
| Demographics | Rating | Rank | Family Poverty |
| Immigrants | Immigrants | 3.6 /100 | #225 | Tragic 10.0% |
| Ottawa | 3.3 /100 | #226 | Tragic 10.0% |
| Immigrants | Armenia | 3.3 /100 | #227 | Tragic 10.0% |
| Sudanese | 3.1 /100 | #228 | Tragic 10.0% |
| Immigrants | Uzbekistan | 3.1 /100 | #229 | Tragic 10.0% |
| Immigrants | Panama | 3.1 /100 | #230 | Tragic 10.0% |
| Alaskan Athabascans | 2.7 /100 | #231 | Tragic 10.1% |
| Immigrants | Sudan | 2.3 /100 | #232 | Tragic 10.1% |
| Fijians | 2.1 /100 | #233 | Tragic 10.1% |
| Immigrants | Middle Africa | 2.1 /100 | #234 | Tragic 10.1% |
| Nigerians | 2.0 /100 | #235 | Tragic 10.1% |
| Immigrants | Nigeria | 1.9 /100 | #236 | Tragic 10.2% |
| Immigrants | Laos | 1.7 /100 | #237 | Tragic 10.2% |
| French American Indians | 1.5 /100 | #238 | Tragic 10.2% |
| Potawatomi | 1.5 /100 | #239 | Tragic 10.2% |