Albanian vs Immigrants from Sudan Associate's Degree
COMPARE
Albanian
Immigrants from Sudan
Associate's Degree
Associate's Degree Comparison
Albanians
Immigrants from Sudan
48.8%
ASSOCIATE'S DEGREE
94.7/ 100
METRIC RATING
118th/ 347
METRIC RANK
47.4%
ASSOCIATE'S DEGREE
77.9/ 100
METRIC RATING
146th/ 347
METRIC RANK
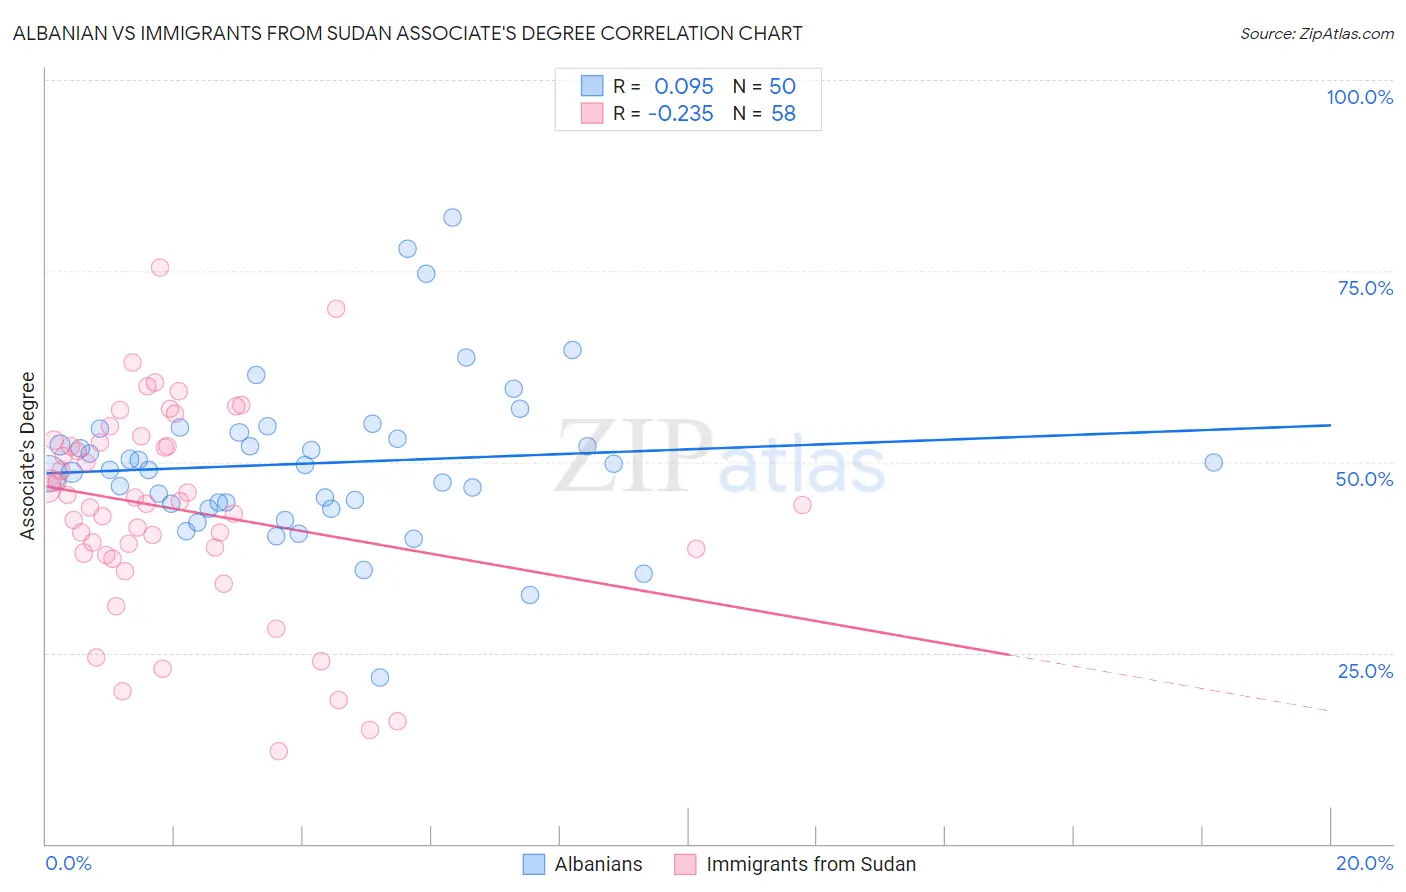
Albanian vs Immigrants from Sudan Associate's Degree Correlation Chart
The statistical analysis conducted on geographies consisting of 193,247,791 people shows a slight positive correlation between the proportion of Albanians and percentage of population with at least associate's degree education in the United States with a correlation coefficient (R) of 0.095 and weighted average of 48.8%. Similarly, the statistical analysis conducted on geographies consisting of 118,972,993 people shows a weak negative correlation between the proportion of Immigrants from Sudan and percentage of population with at least associate's degree education in the United States with a correlation coefficient (R) of -0.235 and weighted average of 47.4%, a difference of 3.0%.
Associate's Degree Correlation Summary
| Measurement | Albanian | Immigrants from Sudan |
| Minimum | 21.7% | 12.1% |
| Maximum | 82.0% | 75.4% |
| Range | 60.3% | 63.3% |
| Mean | 49.8% | 43.8% |
| Median | 49.3% | 44.7% |
| Interquartile 25% (IQ1) | 44.6% | 38.1% |
| Interquartile 75% (IQ3) | 53.9% | 52.5% |
| Interquartile Range (IQR) | 9.3% | 14.4% |
| Standard Deviation (Sample) | 10.6% | 13.4% |
| Standard Deviation (Population) | 10.5% | 13.3% |
Similar Demographics by Associate's Degree
Demographics Similar to Albanians by Associate's Degree
In terms of associate's degree, the demographic groups most similar to Albanians are Lebanese (48.8%, a difference of 0.010%), Alsatian (48.8%, a difference of 0.030%), Afghan (48.9%, a difference of 0.060%), British (48.9%, a difference of 0.11%), and Luxembourger (48.9%, a difference of 0.17%).
| Demographics | Rating | Rank | Associate's Degree |
| Immigrants | Venezuela | 95.8 /100 | #111 | Exceptional 49.1% |
| Immigrants | Chile | 95.3 /100 | #112 | Exceptional 49.0% |
| Palestinians | 95.3 /100 | #113 | Exceptional 49.0% |
| Arabs | 95.3 /100 | #114 | Exceptional 49.0% |
| Luxembourgers | 95.1 /100 | #115 | Exceptional 48.9% |
| British | 95.0 /100 | #116 | Exceptional 48.9% |
| Afghans | 94.8 /100 | #117 | Exceptional 48.9% |
| Albanians | 94.7 /100 | #118 | Exceptional 48.8% |
| Lebanese | 94.6 /100 | #119 | Exceptional 48.8% |
| Alsatians | 94.6 /100 | #120 | Exceptional 48.8% |
| Ugandans | 93.9 /100 | #121 | Exceptional 48.7% |
| Italians | 93.9 /100 | #122 | Exceptional 48.7% |
| Brazilians | 93.7 /100 | #123 | Exceptional 48.7% |
| Serbians | 92.6 /100 | #124 | Exceptional 48.5% |
| Chinese | 92.5 /100 | #125 | Exceptional 48.5% |
Demographics Similar to Immigrants from Sudan by Associate's Degree
In terms of associate's degree, the demographic groups most similar to Immigrants from Sudan are Danish (47.4%, a difference of 0.050%), South American Indian (47.4%, a difference of 0.12%), Canadian (47.5%, a difference of 0.13%), Immigrants from Armenia (47.4%, a difference of 0.13%), and Iraqi (47.4%, a difference of 0.17%).
| Demographics | Rating | Rank | Associate's Degree |
| Slovenes | 85.1 /100 | #139 | Excellent 47.9% |
| Immigrants | Southern Europe | 84.4 /100 | #140 | Excellent 47.8% |
| Taiwanese | 83.3 /100 | #141 | Excellent 47.7% |
| Sierra Leoneans | 82.9 /100 | #142 | Excellent 47.7% |
| Norwegians | 81.0 /100 | #143 | Excellent 47.6% |
| Slavs | 80.5 /100 | #144 | Excellent 47.6% |
| Canadians | 79.0 /100 | #145 | Good 47.5% |
| Immigrants | Sudan | 77.9 /100 | #146 | Good 47.4% |
| Danes | 77.3 /100 | #147 | Good 47.4% |
| South American Indians | 76.7 /100 | #148 | Good 47.4% |
| Immigrants | Armenia | 76.6 /100 | #149 | Good 47.4% |
| Iraqis | 76.2 /100 | #150 | Good 47.4% |
| Immigrants | North Macedonia | 76.0 /100 | #151 | Good 47.4% |
| Immigrants | Afghanistan | 74.3 /100 | #152 | Good 47.3% |
| Czechs | 72.2 /100 | #153 | Good 47.2% |