Immigrants from Germany vs Immigrants from Sudan Family Poverty
COMPARE
Immigrants from Germany
Immigrants from Sudan
Family Poverty
Family Poverty Comparison
Immigrants from Germany
Immigrants from Sudan
8.5%
FAMILY POVERTY
83.3/ 100
METRIC RATING
143rd/ 347
METRIC RANK
10.1%
FAMILY POVERTY
2.3/ 100
METRIC RATING
232nd/ 347
METRIC RANK
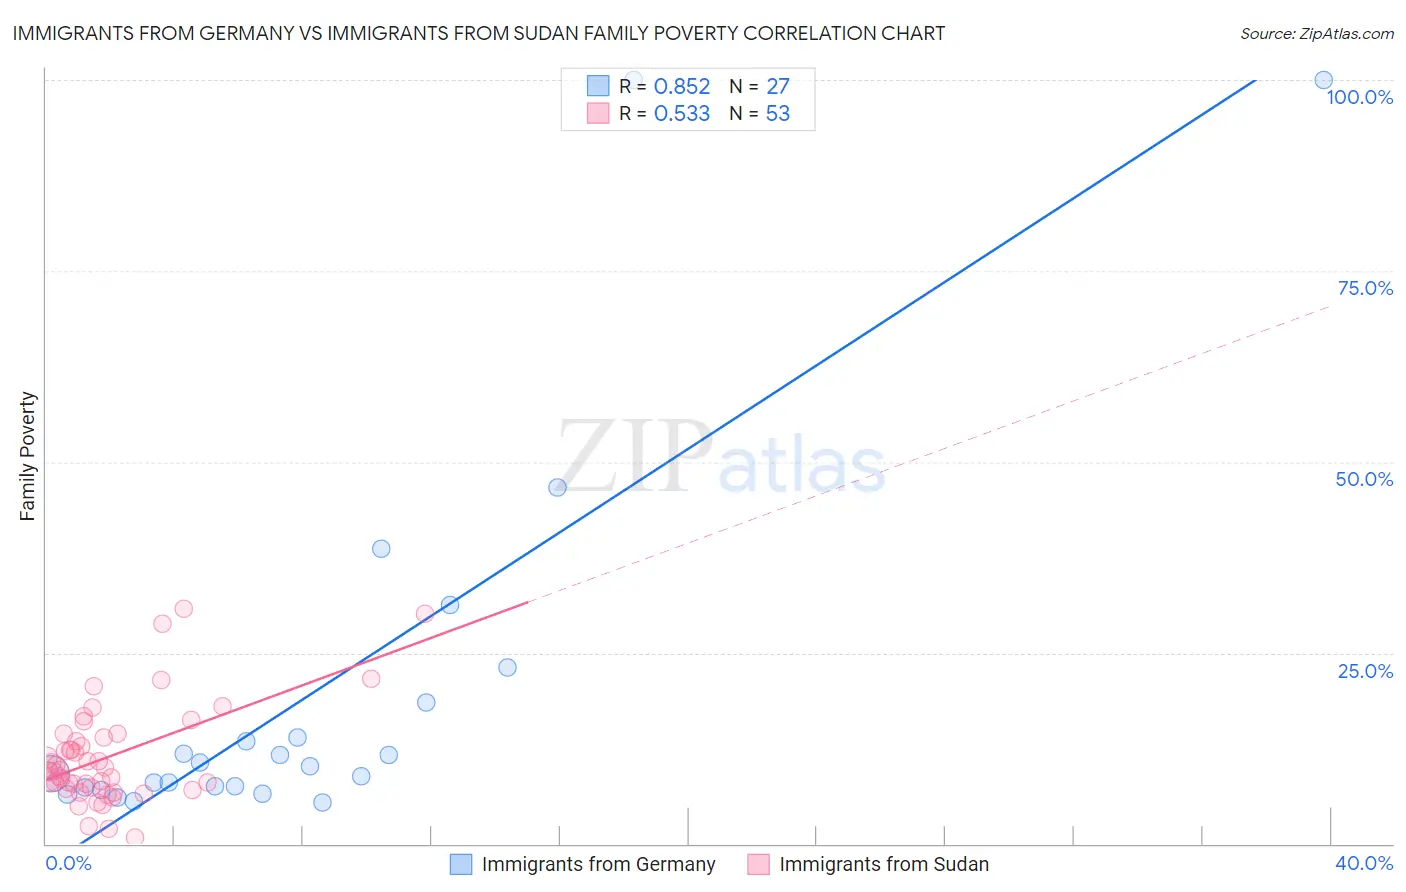
Immigrants from Germany vs Immigrants from Sudan Family Poverty Correlation Chart
The statistical analysis conducted on geographies consisting of 462,312,893 people shows a very strong positive correlation between the proportion of Immigrants from Germany and poverty level among families in the United States with a correlation coefficient (R) of 0.852 and weighted average of 8.5%. Similarly, the statistical analysis conducted on geographies consisting of 118,923,711 people shows a substantial positive correlation between the proportion of Immigrants from Sudan and poverty level among families in the United States with a correlation coefficient (R) of 0.533 and weighted average of 10.1%, a difference of 18.5%.
Family Poverty Correlation Summary
| Measurement | Immigrants from Germany | Immigrants from Sudan |
| Minimum | 5.4% | 0.80% |
| Maximum | 100.0% | 30.8% |
| Range | 94.6% | 30.0% |
| Mean | 19.8% | 11.4% |
| Median | 10.2% | 9.7% |
| Interquartile 25% (IQ1) | 7.3% | 7.3% |
| Interquartile 75% (IQ3) | 18.4% | 14.1% |
| Interquartile Range (IQR) | 11.1% | 6.9% |
| Standard Deviation (Sample) | 25.3% | 6.5% |
| Standard Deviation (Population) | 24.8% | 6.4% |
Similar Demographics by Family Poverty
Demographics Similar to Immigrants from Germany by Family Poverty
In terms of family poverty, the demographic groups most similar to Immigrants from Germany are Albanian (8.5%, a difference of 0.020%), Yugoslavian (8.5%, a difference of 0.030%), Immigrants from South Eastern Asia (8.5%, a difference of 0.040%), Immigrants from Belarus (8.5%, a difference of 0.050%), and Immigrants from Jordan (8.5%, a difference of 0.080%).
| Demographics | Rating | Rank | Family Poverty |
| Immigrants | Brazil | 86.3 /100 | #136 | Excellent 8.5% |
| Immigrants | Southern Europe | 86.0 /100 | #137 | Excellent 8.5% |
| Armenians | 84.6 /100 | #138 | Excellent 8.5% |
| Immigrants | Nepal | 84.2 /100 | #139 | Excellent 8.5% |
| Immigrants | Kazakhstan | 84.1 /100 | #140 | Excellent 8.5% |
| Immigrants | Ukraine | 83.9 /100 | #141 | Excellent 8.5% |
| Yugoslavians | 83.5 /100 | #142 | Excellent 8.5% |
| Immigrants | Germany | 83.3 /100 | #143 | Excellent 8.5% |
| Albanians | 83.3 /100 | #144 | Excellent 8.5% |
| Immigrants | South Eastern Asia | 83.2 /100 | #145 | Excellent 8.5% |
| Immigrants | Belarus | 83.2 /100 | #146 | Excellent 8.5% |
| Immigrants | Jordan | 83.0 /100 | #147 | Excellent 8.5% |
| Scotch-Irish | 82.2 /100 | #148 | Excellent 8.6% |
| Mongolians | 80.4 /100 | #149 | Excellent 8.6% |
| Syrians | 80.3 /100 | #150 | Excellent 8.6% |
Demographics Similar to Immigrants from Sudan by Family Poverty
In terms of family poverty, the demographic groups most similar to Immigrants from Sudan are Fijian (10.1%, a difference of 0.25%), Immigrants from Middle Africa (10.1%, a difference of 0.36%), Nigerian (10.1%, a difference of 0.39%), Alaskan Athabascan (10.1%, a difference of 0.43%), and Immigrants from Nigeria (10.2%, a difference of 0.64%).
| Demographics | Rating | Rank | Family Poverty |
| Immigrants | Immigrants | 3.6 /100 | #225 | Tragic 10.0% |
| Ottawa | 3.3 /100 | #226 | Tragic 10.0% |
| Immigrants | Armenia | 3.3 /100 | #227 | Tragic 10.0% |
| Sudanese | 3.1 /100 | #228 | Tragic 10.0% |
| Immigrants | Uzbekistan | 3.1 /100 | #229 | Tragic 10.0% |
| Immigrants | Panama | 3.1 /100 | #230 | Tragic 10.0% |
| Alaskan Athabascans | 2.7 /100 | #231 | Tragic 10.1% |
| Immigrants | Sudan | 2.3 /100 | #232 | Tragic 10.1% |
| Fijians | 2.1 /100 | #233 | Tragic 10.1% |
| Immigrants | Middle Africa | 2.1 /100 | #234 | Tragic 10.1% |
| Nigerians | 2.0 /100 | #235 | Tragic 10.1% |
| Immigrants | Nigeria | 1.9 /100 | #236 | Tragic 10.2% |
| Immigrants | Laos | 1.7 /100 | #237 | Tragic 10.2% |
| French American Indians | 1.5 /100 | #238 | Tragic 10.2% |
| Potawatomi | 1.5 /100 | #239 | Tragic 10.2% |