Albanian vs Immigrants from Sudan 8th Grade
COMPARE
Albanian
Immigrants from Sudan
8th Grade
8th Grade Comparison
Albanians
Immigrants from Sudan
96.0%
8TH GRADE
83.1/ 100
METRIC RATING
148th/ 347
METRIC RANK
95.5%
8TH GRADE
15.1/ 100
METRIC RATING
207th/ 347
METRIC RANK
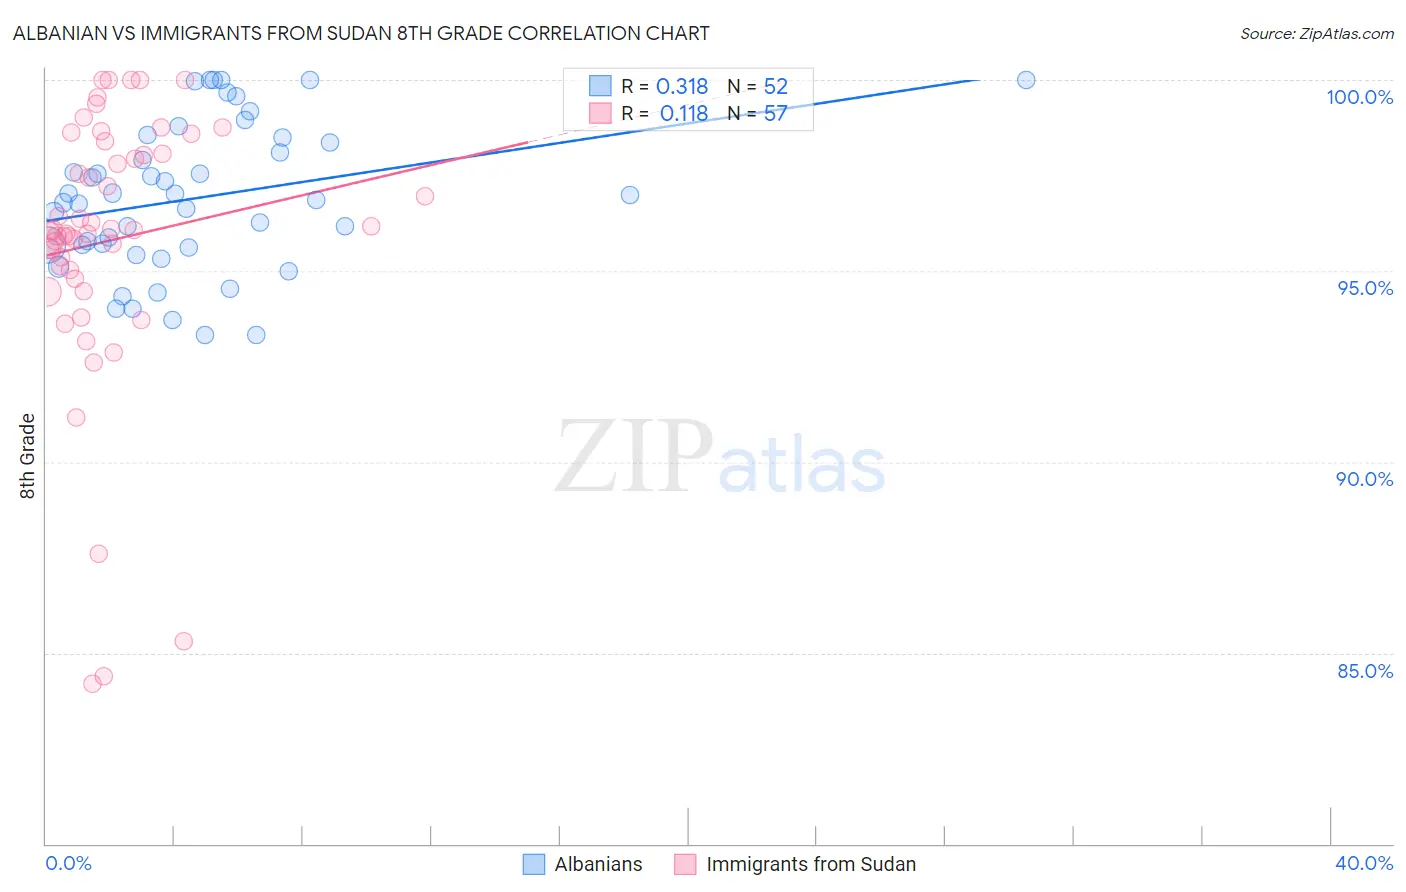
Albanian vs Immigrants from Sudan 8th Grade Correlation Chart
The statistical analysis conducted on geographies consisting of 193,265,850 people shows a mild positive correlation between the proportion of Albanians and percentage of population with at least 8th grade education in the United States with a correlation coefficient (R) of 0.318 and weighted average of 96.0%. Similarly, the statistical analysis conducted on geographies consisting of 118,959,807 people shows a poor positive correlation between the proportion of Immigrants from Sudan and percentage of population with at least 8th grade education in the United States with a correlation coefficient (R) of 0.118 and weighted average of 95.5%, a difference of 0.54%.
8th Grade Correlation Summary
| Measurement | Albanian | Immigrants from Sudan |
| Minimum | 93.3% | 84.2% |
| Maximum | 100.0% | 100.0% |
| Range | 6.7% | 15.8% |
| Mean | 96.9% | 95.8% |
| Median | 96.9% | 96.1% |
| Interquartile 25% (IQ1) | 95.6% | 94.9% |
| Interquartile 75% (IQ3) | 98.4% | 98.2% |
| Interquartile Range (IQR) | 2.8% | 3.3% |
| Standard Deviation (Sample) | 1.9% | 3.6% |
| Standard Deviation (Population) | 1.9% | 3.5% |
Similar Demographics by 8th Grade
Demographics Similar to Albanians by 8th Grade
In terms of 8th grade, the demographic groups most similar to Albanians are Lumbee (96.0%, a difference of 0.010%), Israeli (96.0%, a difference of 0.010%), Colville (96.0%, a difference of 0.010%), Spanish (96.0%, a difference of 0.020%), and Immigrants from Belarus (96.0%, a difference of 0.020%).
| Demographics | Rating | Rank | 8th Grade |
| Immigrants | Greece | 85.9 /100 | #141 | Excellent 96.0% |
| Immigrants | Eastern Europe | 85.4 /100 | #142 | Excellent 96.0% |
| Spanish | 85.1 /100 | #143 | Excellent 96.0% |
| Immigrants | Belarus | 84.8 /100 | #144 | Excellent 96.0% |
| Lumbee | 84.1 /100 | #145 | Excellent 96.0% |
| Israelis | 84.1 /100 | #146 | Excellent 96.0% |
| Colville | 84.0 /100 | #147 | Excellent 96.0% |
| Albanians | 83.1 /100 | #148 | Excellent 96.0% |
| Immigrants | Israel | 81.3 /100 | #149 | Excellent 96.0% |
| Immigrants | Russia | 80.9 /100 | #150 | Excellent 96.0% |
| Blackfeet | 80.8 /100 | #151 | Excellent 96.0% |
| French American Indians | 80.6 /100 | #152 | Excellent 96.0% |
| Immigrants | Jordan | 79.5 /100 | #153 | Good 95.9% |
| Hopi | 79.4 /100 | #154 | Good 95.9% |
| Kenyans | 74.5 /100 | #155 | Good 95.9% |
Demographics Similar to Immigrants from Sudan by 8th Grade
In terms of 8th grade, the demographic groups most similar to Immigrants from Sudan are Portuguese (95.5%, a difference of 0.010%), Hawaiian (95.5%, a difference of 0.020%), Immigrants from Bahamas (95.5%, a difference of 0.020%), Comanche (95.5%, a difference of 0.020%), and Immigrants from Lebanon (95.4%, a difference of 0.020%).
| Demographics | Rating | Rank | 8th Grade |
| Argentineans | 22.2 /100 | #200 | Fair 95.5% |
| Immigrants | Argentina | 20.6 /100 | #201 | Fair 95.5% |
| Apache | 19.4 /100 | #202 | Poor 95.5% |
| Moroccans | 17.4 /100 | #203 | Poor 95.5% |
| Hawaiians | 16.7 /100 | #204 | Poor 95.5% |
| Immigrants | Bahamas | 16.7 /100 | #205 | Poor 95.5% |
| Comanche | 16.3 /100 | #206 | Poor 95.5% |
| Immigrants | Sudan | 15.1 /100 | #207 | Poor 95.5% |
| Portuguese | 14.3 /100 | #208 | Poor 95.5% |
| Immigrants | Lebanon | 13.7 /100 | #209 | Poor 95.4% |
| Africans | 13.6 /100 | #210 | Poor 95.4% |
| Immigrants | Morocco | 12.4 /100 | #211 | Poor 95.4% |
| Immigrants | Pakistan | 9.7 /100 | #212 | Tragic 95.4% |
| Laotians | 9.0 /100 | #213 | Tragic 95.4% |
| Immigrants | Chile | 9.0 /100 | #214 | Tragic 95.4% |