Albanian vs Ute Family Poverty
COMPARE
Albanian
Ute
Family Poverty
Family Poverty Comparison
Albanians
Ute
8.5%
FAMILY POVERTY
83.3/ 100
METRIC RATING
144th/ 347
METRIC RANK
12.1%
FAMILY POVERTY
0.0/ 100
METRIC RATING
311th/ 347
METRIC RANK
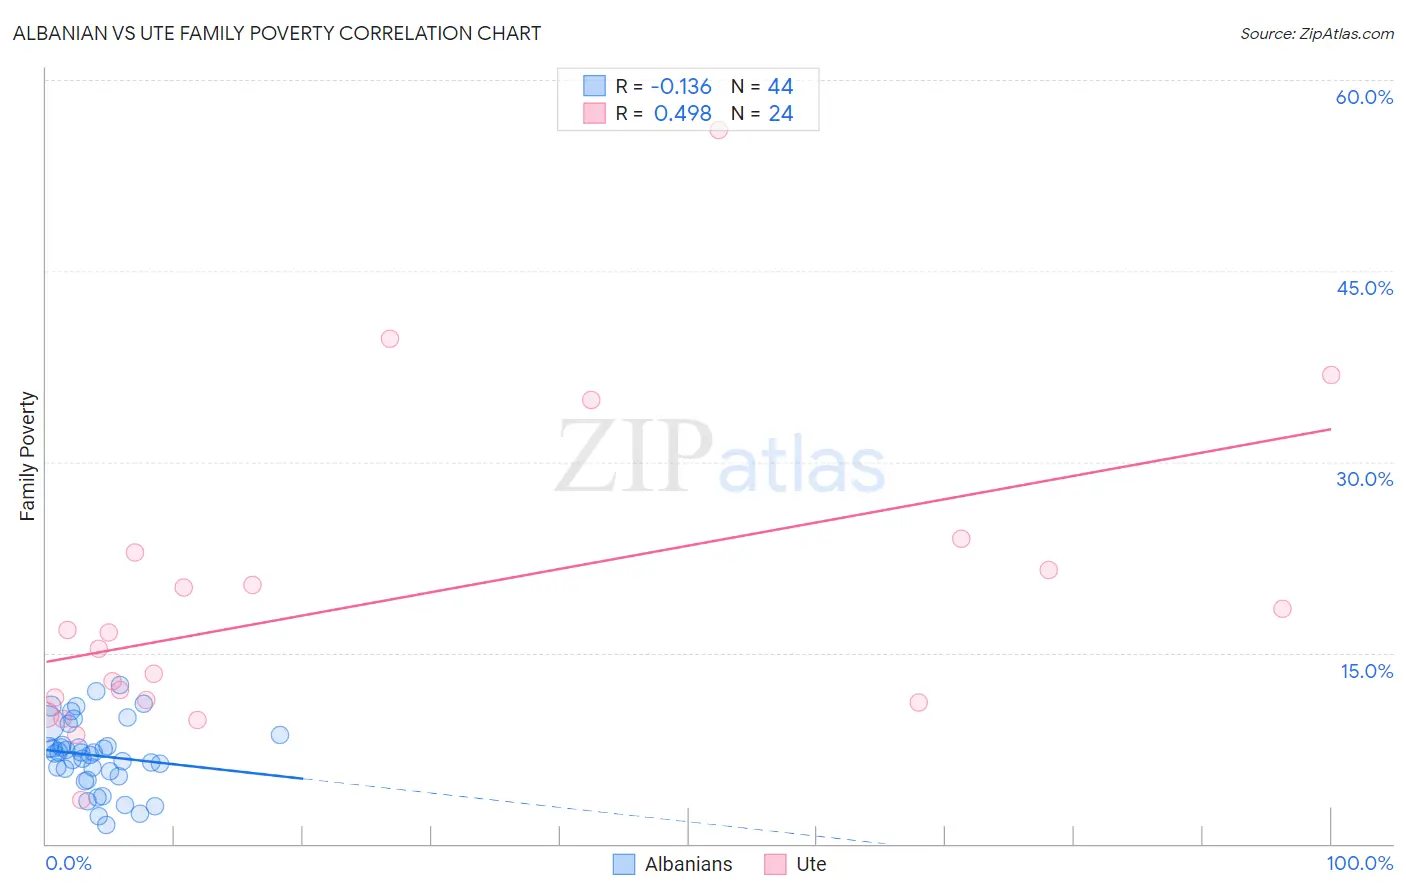
Albanian vs Ute Family Poverty Correlation Chart
The statistical analysis conducted on geographies consisting of 192,873,103 people shows a poor negative correlation between the proportion of Albanians and poverty level among families in the United States with a correlation coefficient (R) of -0.136 and weighted average of 8.5%. Similarly, the statistical analysis conducted on geographies consisting of 55,645,170 people shows a moderate positive correlation between the proportion of Ute and poverty level among families in the United States with a correlation coefficient (R) of 0.498 and weighted average of 12.1%, a difference of 41.3%.
Family Poverty Correlation Summary
| Measurement | Albanian | Ute |
| Minimum | 1.4% | 3.5% |
| Maximum | 12.5% | 56.1% |
| Range | 11.1% | 52.6% |
| Mean | 6.9% | 19.0% |
| Median | 7.1% | 15.9% |
| Interquartile 25% (IQ1) | 5.5% | 11.2% |
| Interquartile 75% (IQ3) | 8.1% | 22.2% |
| Interquartile Range (IQR) | 2.6% | 11.0% |
| Standard Deviation (Sample) | 2.7% | 12.1% |
| Standard Deviation (Population) | 2.6% | 11.8% |
Similar Demographics by Family Poverty
Demographics Similar to Albanians by Family Poverty
In terms of family poverty, the demographic groups most similar to Albanians are Immigrants from Germany (8.5%, a difference of 0.020%), Immigrants from South Eastern Asia (8.5%, a difference of 0.020%), Immigrants from Belarus (8.5%, a difference of 0.030%), Yugoslavian (8.5%, a difference of 0.050%), and Immigrants from Jordan (8.5%, a difference of 0.060%).
| Demographics | Rating | Rank | Family Poverty |
| Immigrants | Southern Europe | 86.0 /100 | #137 | Excellent 8.5% |
| Armenians | 84.6 /100 | #138 | Excellent 8.5% |
| Immigrants | Nepal | 84.2 /100 | #139 | Excellent 8.5% |
| Immigrants | Kazakhstan | 84.1 /100 | #140 | Excellent 8.5% |
| Immigrants | Ukraine | 83.9 /100 | #141 | Excellent 8.5% |
| Yugoslavians | 83.5 /100 | #142 | Excellent 8.5% |
| Immigrants | Germany | 83.3 /100 | #143 | Excellent 8.5% |
| Albanians | 83.3 /100 | #144 | Excellent 8.5% |
| Immigrants | South Eastern Asia | 83.2 /100 | #145 | Excellent 8.5% |
| Immigrants | Belarus | 83.2 /100 | #146 | Excellent 8.5% |
| Immigrants | Jordan | 83.0 /100 | #147 | Excellent 8.5% |
| Scotch-Irish | 82.2 /100 | #148 | Excellent 8.6% |
| Mongolians | 80.4 /100 | #149 | Excellent 8.6% |
| Syrians | 80.3 /100 | #150 | Excellent 8.6% |
| Brazilians | 80.1 /100 | #151 | Excellent 8.6% |
Demographics Similar to Ute by Family Poverty
In terms of family poverty, the demographic groups most similar to Ute are Immigrants from Central America (12.1%, a difference of 0.38%), Hispanic or Latino (12.0%, a difference of 0.84%), Immigrants from Guatemala (12.0%, a difference of 0.84%), Immigrants from Caribbean (12.2%, a difference of 1.1%), and Seminole (11.9%, a difference of 1.3%).
| Demographics | Rating | Rank | Family Poverty |
| Immigrants | Latin America | 0.0 /100 | #304 | Tragic 11.8% |
| Mexicans | 0.0 /100 | #305 | Tragic 11.8% |
| Cajuns | 0.0 /100 | #306 | Tragic 11.9% |
| Immigrants | Congo | 0.0 /100 | #307 | Tragic 11.9% |
| Seminole | 0.0 /100 | #308 | Tragic 11.9% |
| Hispanics or Latinos | 0.0 /100 | #309 | Tragic 12.0% |
| Immigrants | Guatemala | 0.0 /100 | #310 | Tragic 12.0% |
| Ute | 0.0 /100 | #311 | Tragic 12.1% |
| Immigrants | Central America | 0.0 /100 | #312 | Tragic 12.1% |
| Immigrants | Caribbean | 0.0 /100 | #313 | Tragic 12.2% |
| Kiowa | 0.0 /100 | #314 | Tragic 12.2% |
| Immigrants | Mexico | 0.0 /100 | #315 | Tragic 12.3% |
| Hondurans | 0.0 /100 | #316 | Tragic 12.4% |
| Immigrants | Grenada | 0.0 /100 | #317 | Tragic 12.4% |
| U.S. Virgin Islanders | 0.0 /100 | #318 | Tragic 12.4% |