Albanian vs Immigrants from Eastern Africa Family Poverty
COMPARE
Albanian
Immigrants from Eastern Africa
Family Poverty
Family Poverty Comparison
Albanians
Immigrants from Eastern Africa
8.5%
FAMILY POVERTY
83.3/ 100
METRIC RATING
144th/ 347
METRIC RANK
9.5%
FAMILY POVERTY
15.1/ 100
METRIC RATING
208th/ 347
METRIC RANK
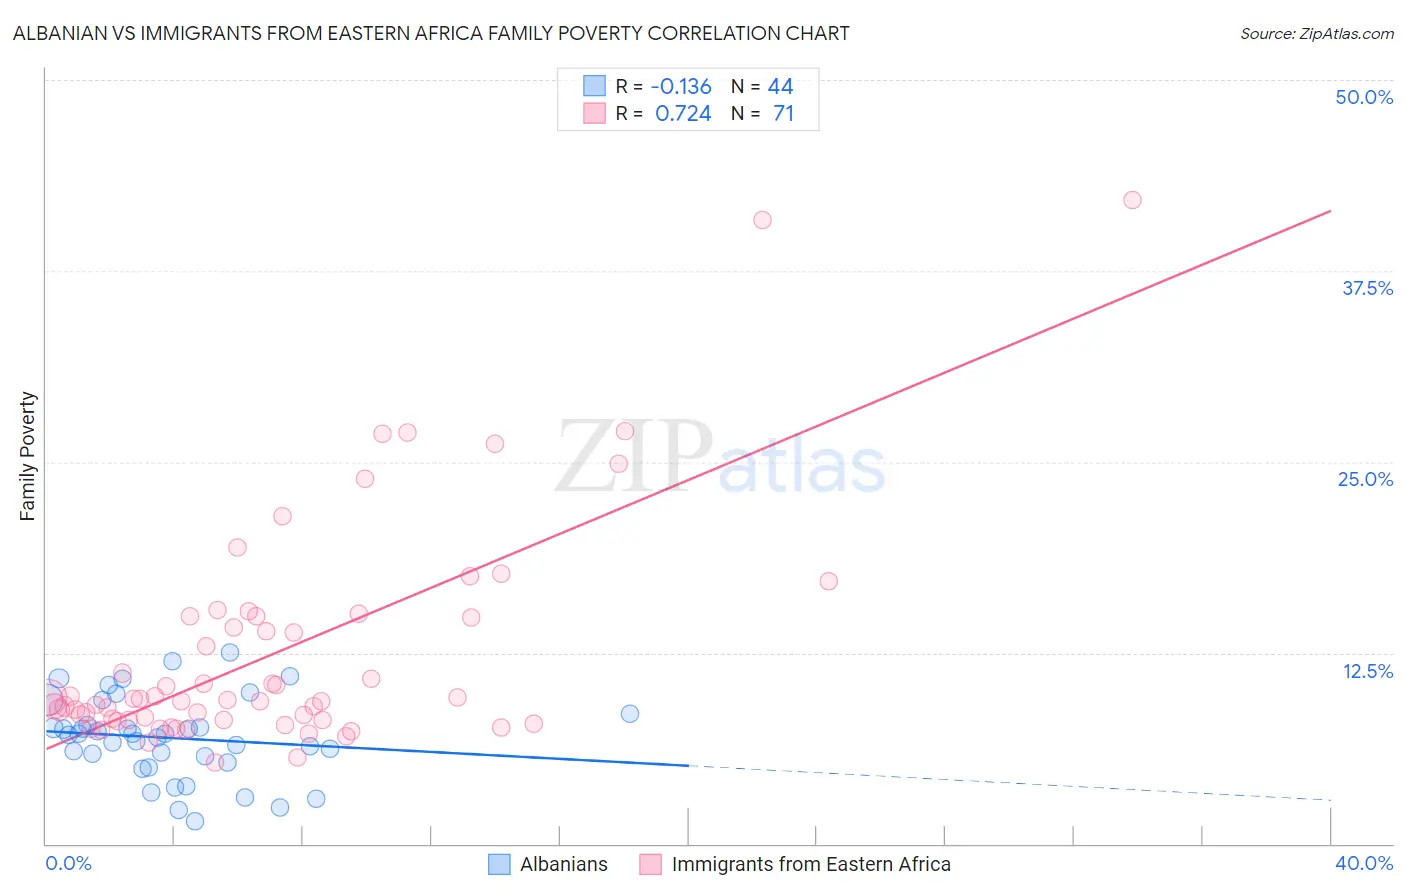
Albanian vs Immigrants from Eastern Africa Family Poverty Correlation Chart
The statistical analysis conducted on geographies consisting of 192,873,103 people shows a poor negative correlation between the proportion of Albanians and poverty level among families in the United States with a correlation coefficient (R) of -0.136 and weighted average of 8.5%. Similarly, the statistical analysis conducted on geographies consisting of 354,301,294 people shows a strong positive correlation between the proportion of Immigrants from Eastern Africa and poverty level among families in the United States with a correlation coefficient (R) of 0.724 and weighted average of 9.5%, a difference of 11.5%.
Family Poverty Correlation Summary
| Measurement | Albanian | Immigrants from Eastern Africa |
| Minimum | 1.4% | 5.3% |
| Maximum | 12.5% | 42.2% |
| Range | 11.1% | 36.8% |
| Mean | 6.9% | 12.5% |
| Median | 7.1% | 9.4% |
| Interquartile 25% (IQ1) | 5.5% | 8.1% |
| Interquartile 75% (IQ3) | 8.1% | 14.9% |
| Interquartile Range (IQR) | 2.6% | 6.7% |
| Standard Deviation (Sample) | 2.7% | 7.4% |
| Standard Deviation (Population) | 2.6% | 7.4% |
Similar Demographics by Family Poverty
Demographics Similar to Albanians by Family Poverty
In terms of family poverty, the demographic groups most similar to Albanians are Immigrants from Germany (8.5%, a difference of 0.020%), Immigrants from South Eastern Asia (8.5%, a difference of 0.020%), Immigrants from Belarus (8.5%, a difference of 0.030%), Yugoslavian (8.5%, a difference of 0.050%), and Immigrants from Jordan (8.5%, a difference of 0.060%).
| Demographics | Rating | Rank | Family Poverty |
| Immigrants | Southern Europe | 86.0 /100 | #137 | Excellent 8.5% |
| Armenians | 84.6 /100 | #138 | Excellent 8.5% |
| Immigrants | Nepal | 84.2 /100 | #139 | Excellent 8.5% |
| Immigrants | Kazakhstan | 84.1 /100 | #140 | Excellent 8.5% |
| Immigrants | Ukraine | 83.9 /100 | #141 | Excellent 8.5% |
| Yugoslavians | 83.5 /100 | #142 | Excellent 8.5% |
| Immigrants | Germany | 83.3 /100 | #143 | Excellent 8.5% |
| Albanians | 83.3 /100 | #144 | Excellent 8.5% |
| Immigrants | South Eastern Asia | 83.2 /100 | #145 | Excellent 8.5% |
| Immigrants | Belarus | 83.2 /100 | #146 | Excellent 8.5% |
| Immigrants | Jordan | 83.0 /100 | #147 | Excellent 8.5% |
| Scotch-Irish | 82.2 /100 | #148 | Excellent 8.6% |
| Mongolians | 80.4 /100 | #149 | Excellent 8.6% |
| Syrians | 80.3 /100 | #150 | Excellent 8.6% |
| Brazilians | 80.1 /100 | #151 | Excellent 8.6% |
Demographics Similar to Immigrants from Eastern Africa by Family Poverty
In terms of family poverty, the demographic groups most similar to Immigrants from Eastern Africa are Sierra Leonean (9.5%, a difference of 0.11%), Immigrants from Uruguay (9.5%, a difference of 0.29%), Immigrants from South America (9.5%, a difference of 0.64%), Aleut (9.5%, a difference of 0.65%), and Immigrants from Lebanon (9.4%, a difference of 0.84%).
| Demographics | Rating | Rank | Family Poverty |
| Immigrants | Portugal | 20.5 /100 | #201 | Fair 9.4% |
| Immigrants | Sierra Leone | 19.6 /100 | #202 | Poor 9.4% |
| German Russians | 19.4 /100 | #203 | Poor 9.4% |
| Immigrants | Lebanon | 18.9 /100 | #204 | Poor 9.4% |
| Aleuts | 18.0 /100 | #205 | Poor 9.5% |
| Immigrants | South America | 18.0 /100 | #206 | Poor 9.5% |
| Sierra Leoneans | 15.6 /100 | #207 | Poor 9.5% |
| Immigrants | Eastern Africa | 15.1 /100 | #208 | Poor 9.5% |
| Immigrants | Uruguay | 14.0 /100 | #209 | Poor 9.5% |
| Alsatians | 11.3 /100 | #210 | Poor 9.6% |
| Malaysians | 10.6 /100 | #211 | Poor 9.6% |
| Immigrants | Thailand | 9.7 /100 | #212 | Tragic 9.7% |
| Osage | 8.0 /100 | #213 | Tragic 9.7% |
| Immigrants | Micronesia | 6.7 /100 | #214 | Tragic 9.8% |
| Immigrants | Nonimmigrants | 6.7 /100 | #215 | Tragic 9.8% |