Alaskan Athabascan vs Immigrants from Mexico Female Poverty
COMPARE
Alaskan Athabascan
Immigrants from Mexico
Female Poverty
Female Poverty Comparison
Alaskan Athabascans
Immigrants from Mexico
14.4%
FEMALE POVERTY
5.3/ 100
METRIC RATING
213th/ 347
METRIC RANK
17.0%
FEMALE POVERTY
0.0/ 100
METRIC RATING
309th/ 347
METRIC RANK
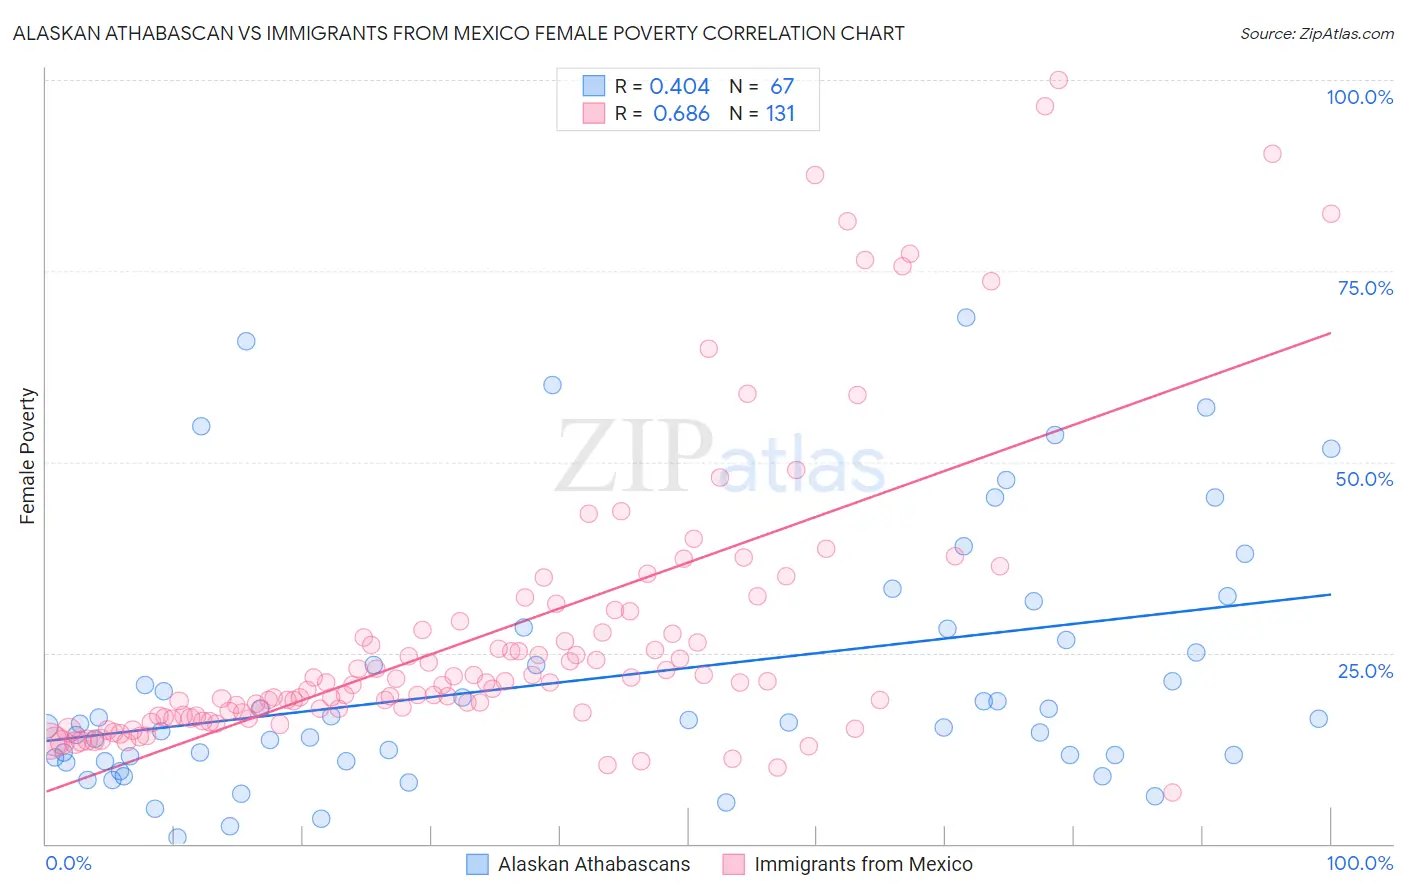
Alaskan Athabascan vs Immigrants from Mexico Female Poverty Correlation Chart
The statistical analysis conducted on geographies consisting of 45,807,044 people shows a moderate positive correlation between the proportion of Alaskan Athabascans and poverty level among females in the United States with a correlation coefficient (R) of 0.404 and weighted average of 14.4%. Similarly, the statistical analysis conducted on geographies consisting of 513,228,632 people shows a significant positive correlation between the proportion of Immigrants from Mexico and poverty level among females in the United States with a correlation coefficient (R) of 0.686 and weighted average of 17.0%, a difference of 18.0%.
Female Poverty Correlation Summary
| Measurement | Alaskan Athabascan | Immigrants from Mexico |
| Minimum | 0.78% | 6.7% |
| Maximum | 69.0% | 100.0% |
| Range | 68.2% | 93.3% |
| Mean | 21.7% | 27.4% |
| Median | 15.9% | 21.1% |
| Interquartile 25% (IQ1) | 11.4% | 16.7% |
| Interquartile 75% (IQ3) | 28.2% | 28.0% |
| Interquartile Range (IQR) | 16.9% | 11.3% |
| Standard Deviation (Sample) | 16.4% | 19.2% |
| Standard Deviation (Population) | 16.3% | 19.1% |
Similar Demographics by Female Poverty
Demographics Similar to Alaskan Athabascans by Female Poverty
In terms of female poverty, the demographic groups most similar to Alaskan Athabascans are Bermudan (14.4%, a difference of 0.080%), Marshallese (14.4%, a difference of 0.16%), Immigrants from Panama (14.4%, a difference of 0.30%), Immigrants from Thailand (14.4%, a difference of 0.39%), and Immigrants (14.4%, a difference of 0.42%).
| Demographics | Rating | Rank | Female Poverty |
| Immigrants | Uruguay | 14.0 /100 | #206 | Poor 14.0% |
| Immigrants | Eastern Africa | 9.0 /100 | #207 | Tragic 14.2% |
| Immigrants | Azores | 7.9 /100 | #208 | Tragic 14.2% |
| Panamanians | 7.7 /100 | #209 | Tragic 14.2% |
| Malaysians | 7.4 /100 | #210 | Tragic 14.3% |
| Moroccans | 7.2 /100 | #211 | Tragic 14.3% |
| Bermudans | 5.5 /100 | #212 | Tragic 14.4% |
| Alaskan Athabascans | 5.3 /100 | #213 | Tragic 14.4% |
| Marshallese | 5.0 /100 | #214 | Tragic 14.4% |
| Immigrants | Panama | 4.7 /100 | #215 | Tragic 14.4% |
| Immigrants | Thailand | 4.5 /100 | #216 | Tragic 14.4% |
| Immigrants | Immigrants | 4.5 /100 | #217 | Tragic 14.4% |
| Immigrants | Uzbekistan | 4.4 /100 | #218 | Tragic 14.4% |
| Japanese | 4.1 /100 | #219 | Tragic 14.5% |
| Alsatians | 4.0 /100 | #220 | Tragic 14.5% |
Demographics Similar to Immigrants from Mexico by Female Poverty
In terms of female poverty, the demographic groups most similar to Immigrants from Mexico are Creek (17.0%, a difference of 0.24%), Immigrants from Guatemala (17.0%, a difference of 0.24%), Immigrants from Somalia (17.0%, a difference of 0.34%), African (16.9%, a difference of 0.39%), and British West Indian (17.0%, a difference of 0.41%).
| Demographics | Rating | Rank | Female Poverty |
| Chippewa | 0.0 /100 | #302 | Tragic 16.7% |
| Choctaw | 0.0 /100 | #303 | Tragic 16.8% |
| Immigrants | Central America | 0.0 /100 | #304 | Tragic 16.8% |
| Immigrants | Grenada | 0.0 /100 | #305 | Tragic 16.8% |
| Immigrants | Caribbean | 0.0 /100 | #306 | Tragic 16.9% |
| Seminole | 0.0 /100 | #307 | Tragic 16.9% |
| Africans | 0.0 /100 | #308 | Tragic 16.9% |
| Immigrants | Mexico | 0.0 /100 | #309 | Tragic 17.0% |
| Creek | 0.0 /100 | #310 | Tragic 17.0% |
| Immigrants | Guatemala | 0.0 /100 | #311 | Tragic 17.0% |
| Immigrants | Somalia | 0.0 /100 | #312 | Tragic 17.0% |
| British West Indians | 0.0 /100 | #313 | Tragic 17.0% |
| Dutch West Indians | 0.0 /100 | #314 | Tragic 17.1% |
| U.S. Virgin Islanders | 0.0 /100 | #315 | Tragic 17.3% |
| Hondurans | 0.0 /100 | #316 | Tragic 17.4% |