Alaskan Athabascan vs Hopi Single Male Poverty
COMPARE
Alaskan Athabascan
Hopi
Single Male Poverty
Single Male Poverty Comparison
Alaskan Athabascans
Hopi
16.1%
SINGLE MALE POVERTY
0.0/ 100
METRIC RATING
314th/ 347
METRIC RANK
27.5%
SINGLE MALE POVERTY
0.0/ 100
METRIC RATING
346th/ 347
METRIC RANK
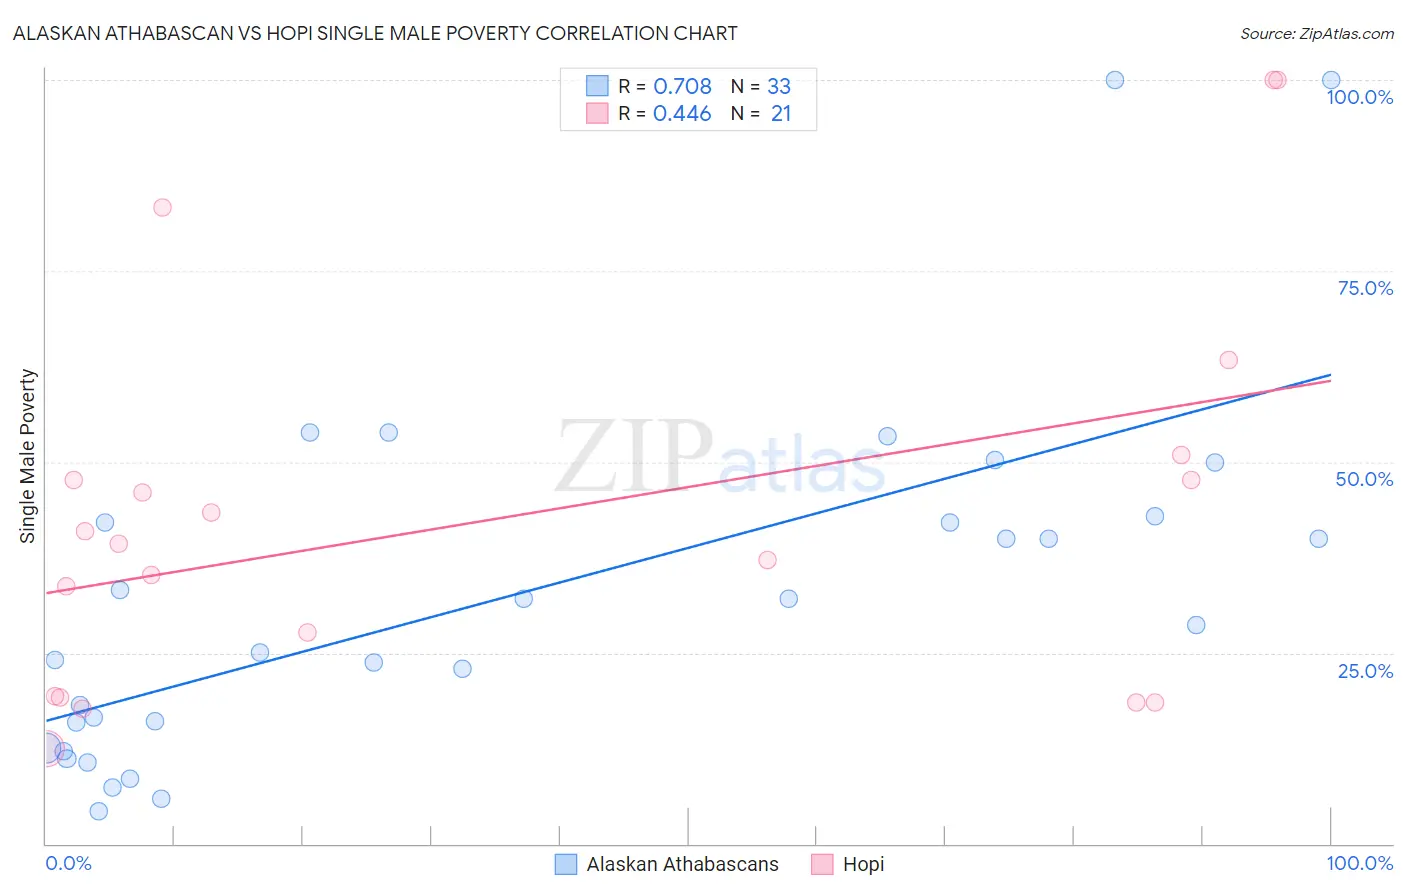
Alaskan Athabascan vs Hopi Single Male Poverty Correlation Chart
The statistical analysis conducted on geographies consisting of 44,419,805 people shows a strong positive correlation between the proportion of Alaskan Athabascans and poverty level among single males in the United States with a correlation coefficient (R) of 0.708 and weighted average of 16.1%. Similarly, the statistical analysis conducted on geographies consisting of 72,721,636 people shows a moderate positive correlation between the proportion of Hopi and poverty level among single males in the United States with a correlation coefficient (R) of 0.446 and weighted average of 27.5%, a difference of 70.8%.
Single Male Poverty Correlation Summary
| Measurement | Alaskan Athabascan | Hopi |
| Minimum | 4.3% | 12.4% |
| Maximum | 100.0% | 100.0% |
| Range | 95.7% | 87.6% |
| Mean | 32.4% | 42.9% |
| Median | 28.6% | 39.3% |
| Interquartile 25% (IQ1) | 14.2% | 19.3% |
| Interquartile 75% (IQ3) | 42.5% | 49.3% |
| Interquartile Range (IQR) | 28.2% | 30.0% |
| Standard Deviation (Sample) | 23.3% | 25.5% |
| Standard Deviation (Population) | 22.9% | 24.9% |
Similar Demographics by Single Male Poverty
Demographics Similar to Alaskan Athabascans by Single Male Poverty
In terms of single male poverty, the demographic groups most similar to Alaskan Athabascans are Cheyenne (16.1%, a difference of 0.040%), Dutch West Indian (16.1%, a difference of 0.19%), Cherokee (16.1%, a difference of 0.29%), Seminole (16.0%, a difference of 0.52%), and Comanche (16.0%, a difference of 0.52%).
| Demographics | Rating | Rank | Single Male Poverty |
| Ute | 0.0 /100 | #307 | Tragic 15.7% |
| Potawatomi | 0.0 /100 | #308 | Tragic 15.8% |
| Americans | 0.0 /100 | #309 | Tragic 15.8% |
| Yakama | 0.0 /100 | #310 | Tragic 15.9% |
| Seminole | 0.0 /100 | #311 | Tragic 16.0% |
| Comanche | 0.0 /100 | #312 | Tragic 16.0% |
| Cherokee | 0.0 /100 | #313 | Tragic 16.1% |
| Alaskan Athabascans | 0.0 /100 | #314 | Tragic 16.1% |
| Cheyenne | 0.0 /100 | #315 | Tragic 16.1% |
| Dutch West Indians | 0.0 /100 | #316 | Tragic 16.1% |
| Blacks/African Americans | 0.0 /100 | #317 | Tragic 16.2% |
| Chickasaw | 0.0 /100 | #318 | Tragic 16.3% |
| Chippewa | 0.0 /100 | #319 | Tragic 16.4% |
| Marshallese | 0.0 /100 | #320 | Tragic 16.4% |
| Osage | 0.0 /100 | #321 | Tragic 16.5% |
Demographics Similar to Hopi by Single Male Poverty
In terms of single male poverty, the demographic groups most similar to Hopi are Navajo (25.3%, a difference of 8.5%), Lumbee (25.2%, a difference of 9.3%), Puerto Rican (25.1%, a difference of 9.7%), Yup'ik (31.6%, a difference of 15.0%), and Houma (23.5%, a difference of 17.3%).
| Demographics | Rating | Rank | Single Male Poverty |
| Inupiat | 0.0 /100 | #333 | Tragic 20.0% |
| Pima | 0.0 /100 | #334 | Tragic 20.2% |
| Yuman | 0.0 /100 | #335 | Tragic 21.3% |
| Tohono O'odham | 0.0 /100 | #336 | Tragic 21.6% |
| Apache | 0.0 /100 | #337 | Tragic 21.6% |
| Pueblo | 0.0 /100 | #338 | Tragic 21.6% |
| Arapaho | 0.0 /100 | #339 | Tragic 21.9% |
| Sioux | 0.0 /100 | #340 | Tragic 22.2% |
| Crow | 0.0 /100 | #341 | Tragic 23.3% |
| Houma | 0.0 /100 | #342 | Tragic 23.5% |
| Puerto Ricans | 0.0 /100 | #343 | Tragic 25.1% |
| Lumbee | 0.0 /100 | #344 | Tragic 25.2% |
| Navajo | 0.0 /100 | #345 | Tragic 25.3% |
| Hopi | 0.0 /100 | #346 | Tragic 27.5% |
| Yup'ik | 0.0 /100 | #347 | Tragic 31.6% |