Yaqui vs Hopi Single Male Poverty
COMPARE
Yaqui
Hopi
Single Male Poverty
Single Male Poverty Comparison
Yaqui
Hopi
14.2%
SINGLE MALE POVERTY
0.0/ 100
METRIC RATING
283rd/ 347
METRIC RANK
27.5%
SINGLE MALE POVERTY
0.0/ 100
METRIC RATING
346th/ 347
METRIC RANK
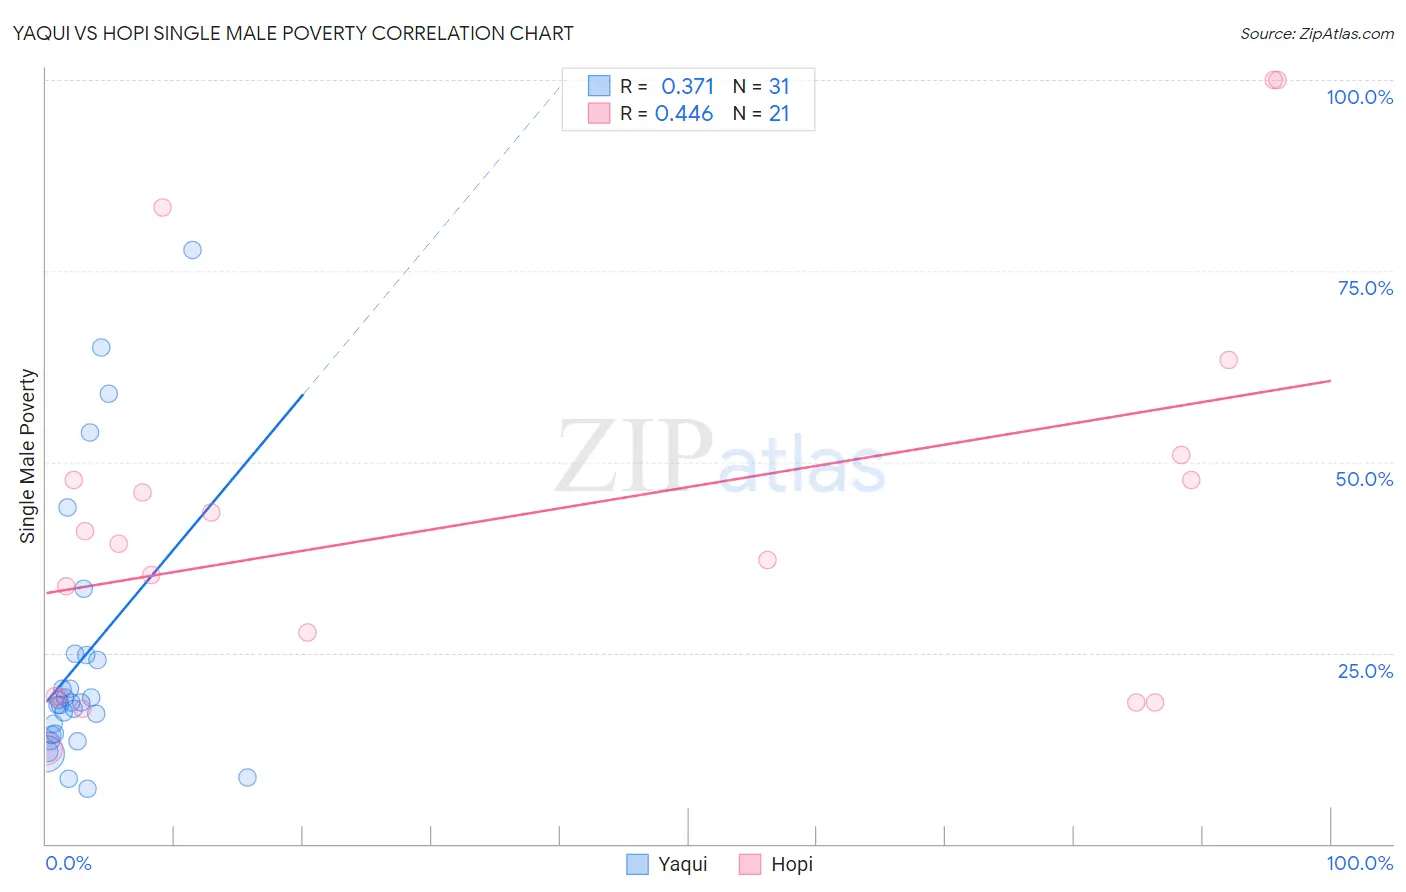
Yaqui vs Hopi Single Male Poverty Correlation Chart
The statistical analysis conducted on geographies consisting of 103,533,102 people shows a mild positive correlation between the proportion of Yaqui and poverty level among single males in the United States with a correlation coefficient (R) of 0.371 and weighted average of 14.2%. Similarly, the statistical analysis conducted on geographies consisting of 72,721,636 people shows a moderate positive correlation between the proportion of Hopi and poverty level among single males in the United States with a correlation coefficient (R) of 0.446 and weighted average of 27.5%, a difference of 93.0%.
Single Male Poverty Correlation Summary
| Measurement | Yaqui | Hopi |
| Minimum | 7.2% | 12.4% |
| Maximum | 77.8% | 100.0% |
| Range | 70.6% | 87.6% |
| Mean | 24.1% | 42.9% |
| Median | 18.4% | 39.3% |
| Interquartile 25% (IQ1) | 14.2% | 19.3% |
| Interquartile 75% (IQ3) | 24.8% | 49.3% |
| Interquartile Range (IQR) | 10.5% | 30.0% |
| Standard Deviation (Sample) | 17.4% | 25.5% |
| Standard Deviation (Population) | 17.1% | 24.9% |
Similar Demographics by Single Male Poverty
Demographics Similar to Yaqui by Single Male Poverty
In terms of single male poverty, the demographic groups most similar to Yaqui are Spanish American (14.2%, a difference of 0.16%), Hispanic or Latino (14.2%, a difference of 0.32%), Hmong (14.2%, a difference of 0.34%), Indonesian (14.1%, a difference of 1.1%), and Slovak (14.1%, a difference of 1.1%).
| Demographics | Rating | Rank | Single Male Poverty |
| Dutch | 0.1 /100 | #276 | Tragic 14.1% |
| Immigrants | Honduras | 0.0 /100 | #277 | Tragic 14.1% |
| Slovaks | 0.0 /100 | #278 | Tragic 14.1% |
| Indonesians | 0.0 /100 | #279 | Tragic 14.1% |
| Hmong | 0.0 /100 | #280 | Tragic 14.2% |
| Hispanics or Latinos | 0.0 /100 | #281 | Tragic 14.2% |
| Spanish Americans | 0.0 /100 | #282 | Tragic 14.2% |
| Yaqui | 0.0 /100 | #283 | Tragic 14.2% |
| Immigrants | Bahamas | 0.0 /100 | #284 | Tragic 14.4% |
| French | 0.0 /100 | #285 | Tragic 14.4% |
| Celtics | 0.0 /100 | #286 | Tragic 14.5% |
| Iroquois | 0.0 /100 | #287 | Tragic 14.5% |
| Whites/Caucasians | 0.0 /100 | #288 | Tragic 14.5% |
| Immigrants | Dominica | 0.0 /100 | #289 | Tragic 14.5% |
| U.S. Virgin Islanders | 0.0 /100 | #290 | Tragic 14.5% |
Demographics Similar to Hopi by Single Male Poverty
In terms of single male poverty, the demographic groups most similar to Hopi are Navajo (25.3%, a difference of 8.5%), Lumbee (25.2%, a difference of 9.3%), Puerto Rican (25.1%, a difference of 9.7%), Yup'ik (31.6%, a difference of 15.0%), and Houma (23.5%, a difference of 17.3%).
| Demographics | Rating | Rank | Single Male Poverty |
| Inupiat | 0.0 /100 | #333 | Tragic 20.0% |
| Pima | 0.0 /100 | #334 | Tragic 20.2% |
| Yuman | 0.0 /100 | #335 | Tragic 21.3% |
| Tohono O'odham | 0.0 /100 | #336 | Tragic 21.6% |
| Apache | 0.0 /100 | #337 | Tragic 21.6% |
| Pueblo | 0.0 /100 | #338 | Tragic 21.6% |
| Arapaho | 0.0 /100 | #339 | Tragic 21.9% |
| Sioux | 0.0 /100 | #340 | Tragic 22.2% |
| Crow | 0.0 /100 | #341 | Tragic 23.3% |
| Houma | 0.0 /100 | #342 | Tragic 23.5% |
| Puerto Ricans | 0.0 /100 | #343 | Tragic 25.1% |
| Lumbee | 0.0 /100 | #344 | Tragic 25.2% |
| Navajo | 0.0 /100 | #345 | Tragic 25.3% |
| Hopi | 0.0 /100 | #346 | Tragic 27.5% |
| Yup'ik | 0.0 /100 | #347 | Tragic 31.6% |