Alaskan Athabascan vs Hopi Unemployment Among Ages 16 to 19 years
COMPARE
Alaskan Athabascan
Hopi
Unemployment Among Ages 16 to 19 years
Unemployment Among Ages 16 to 19 years Comparison
Alaskan Athabascans
Hopi
17.7%
UNEMPLOYMENT AMONG AGES 16 TO 19 YEARS
34.1/ 100
METRIC RATING
196th/ 347
METRIC RANK
30.7%
UNEMPLOYMENT AMONG AGES 16 TO 19 YEARS
0.0/ 100
METRIC RATING
345th/ 347
METRIC RANK
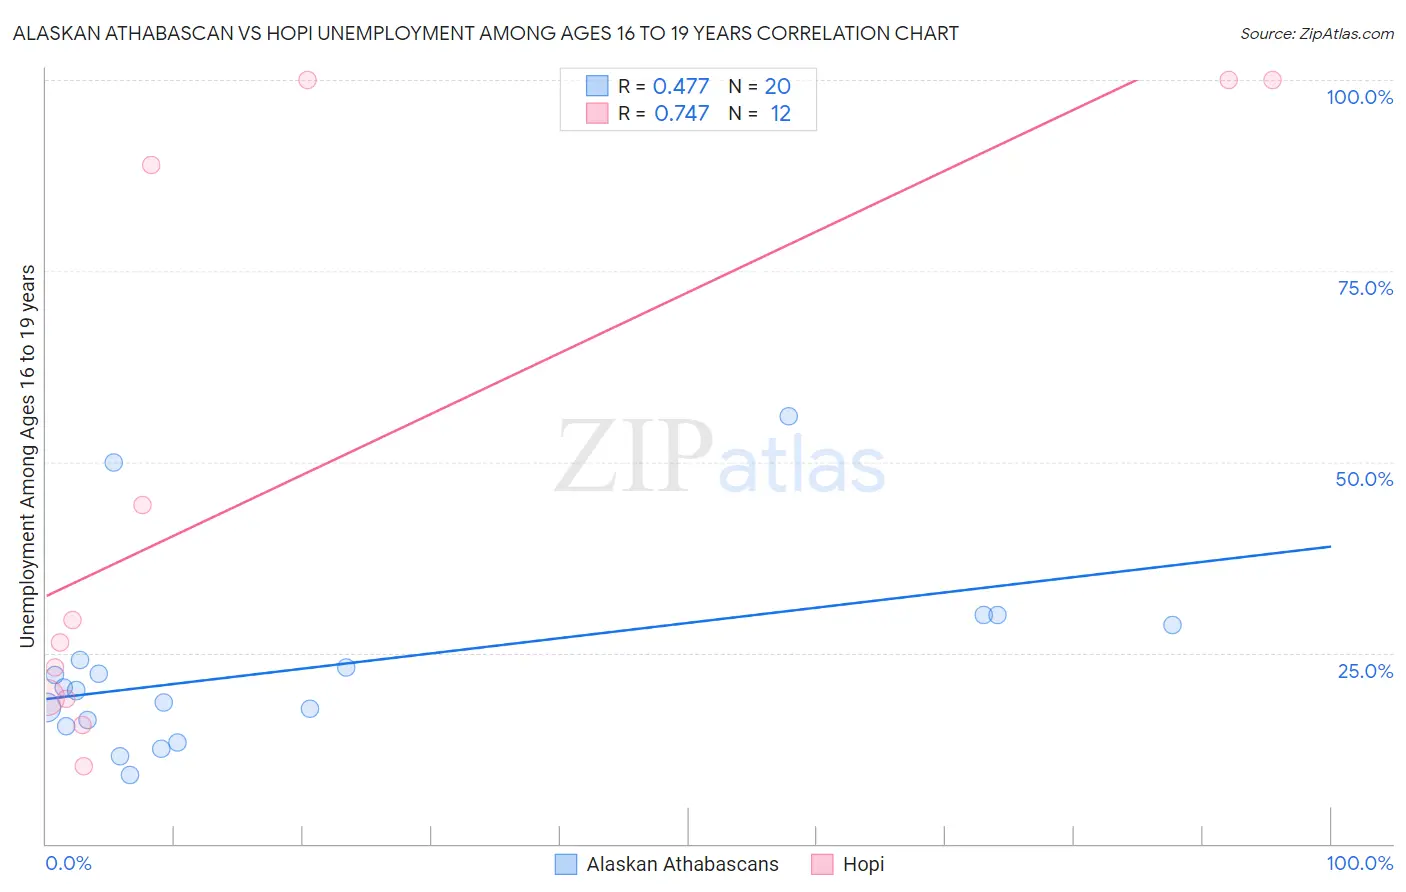
Alaskan Athabascan vs Hopi Unemployment Among Ages 16 to 19 years Correlation Chart
The statistical analysis conducted on geographies consisting of 45,046,237 people shows a moderate positive correlation between the proportion of Alaskan Athabascans and unemployment rate among population between the ages 16 and 19 in the United States with a correlation coefficient (R) of 0.477 and weighted average of 17.7%. Similarly, the statistical analysis conducted on geographies consisting of 73,873,422 people shows a strong positive correlation between the proportion of Hopi and unemployment rate among population between the ages 16 and 19 in the United States with a correlation coefficient (R) of 0.747 and weighted average of 30.7%, a difference of 73.1%.
Unemployment Among Ages 16 to 19 years Correlation Summary
| Measurement | Alaskan Athabascan | Hopi |
| Minimum | 9.0% | 10.2% |
| Maximum | 56.0% | 100.0% |
| Range | 47.0% | 89.8% |
| Mean | 22.9% | 48.0% |
| Median | 20.2% | 27.8% |
| Interquartile 25% (IQ1) | 15.9% | 19.0% |
| Interquartile 75% (IQ3) | 26.4% | 94.5% |
| Interquartile Range (IQR) | 10.5% | 75.4% |
| Standard Deviation (Sample) | 11.9% | 37.4% |
| Standard Deviation (Population) | 11.6% | 35.8% |
Similar Demographics by Unemployment Among Ages 16 to 19 years
Demographics Similar to Alaskan Athabascans by Unemployment Among Ages 16 to 19 years
In terms of unemployment among ages 16 to 19 years, the demographic groups most similar to Alaskan Athabascans are Immigrants from Peru (17.7%, a difference of 0.16%), Immigrants from Czechoslovakia (17.8%, a difference of 0.23%), Peruvian (17.7%, a difference of 0.24%), Ethiopian (17.8%, a difference of 0.24%), and Immigrants from Ireland (17.8%, a difference of 0.30%).
| Demographics | Rating | Rank | Unemployment Among Ages 16 to 19 years |
| Immigrants | Europe | 41.8 /100 | #189 | Average 17.6% |
| Marshallese | 41.7 /100 | #190 | Average 17.6% |
| Immigrants | Costa Rica | 41.3 /100 | #191 | Average 17.6% |
| Immigrants | Philippines | 40.7 /100 | #192 | Average 17.7% |
| Immigrants | Australia | 40.6 /100 | #193 | Average 17.7% |
| Peruvians | 38.8 /100 | #194 | Fair 17.7% |
| Immigrants | Peru | 37.3 /100 | #195 | Fair 17.7% |
| Alaskan Athabascans | 34.1 /100 | #196 | Fair 17.7% |
| Immigrants | Czechoslovakia | 29.8 /100 | #197 | Fair 17.8% |
| Ethiopians | 29.6 /100 | #198 | Fair 17.8% |
| Immigrants | Ireland | 28.5 /100 | #199 | Fair 17.8% |
| Immigrants | Fiji | 27.7 /100 | #200 | Fair 17.8% |
| Immigrants | Ethiopia | 27.4 /100 | #201 | Fair 17.8% |
| Immigrants | Portugal | 27.2 /100 | #202 | Fair 17.8% |
| Immigrants | Eastern Europe | 23.6 /100 | #203 | Fair 17.8% |
Demographics Similar to Hopi by Unemployment Among Ages 16 to 19 years
In terms of unemployment among ages 16 to 19 years, the demographic groups most similar to Hopi are Colville (29.7%, a difference of 3.3%), Navajo (29.0%, a difference of 5.6%), Inupiat (28.1%, a difference of 9.3%), Puerto Rican (27.5%, a difference of 11.5%), and Crow (26.2%, a difference of 16.9%).
| Demographics | Rating | Rank | Unemployment Among Ages 16 to 19 years |
| Paiute | 0.0 /100 | #333 | Tragic 24.4% |
| Guyanese | 0.0 /100 | #334 | Tragic 24.8% |
| Arapaho | 0.0 /100 | #335 | Tragic 25.2% |
| Kiowa | 0.0 /100 | #336 | Tragic 25.2% |
| Immigrants | Guyana | 0.0 /100 | #337 | Tragic 25.5% |
| Immigrants | St. Vincent and the Grenadines | 0.0 /100 | #338 | Tragic 25.7% |
| Immigrants | Grenada | 0.0 /100 | #339 | Tragic 25.7% |
| Crow | 0.0 /100 | #340 | Tragic 26.2% |
| Puerto Ricans | 0.0 /100 | #341 | Tragic 27.5% |
| Inupiat | 0.0 /100 | #342 | Tragic 28.1% |
| Navajo | 0.0 /100 | #343 | Tragic 29.0% |
| Colville | 0.0 /100 | #344 | Tragic 29.7% |
| Hopi | 0.0 /100 | #345 | Tragic 30.7% |
| Yuman | 0.0 /100 | #346 | Tragic 37.4% |
| Yup'ik | 0.0 /100 | #347 | Tragic 41.0% |