Alaskan Athabascan vs Comanche Single Male Poverty
COMPARE
Alaskan Athabascan
Comanche
Single Male Poverty
Single Male Poverty Comparison
Alaskan Athabascans
Comanche
16.1%
SINGLE MALE POVERTY
0.0/ 100
METRIC RATING
314th/ 347
METRIC RANK
16.0%
SINGLE MALE POVERTY
0.0/ 100
METRIC RATING
312th/ 347
METRIC RANK
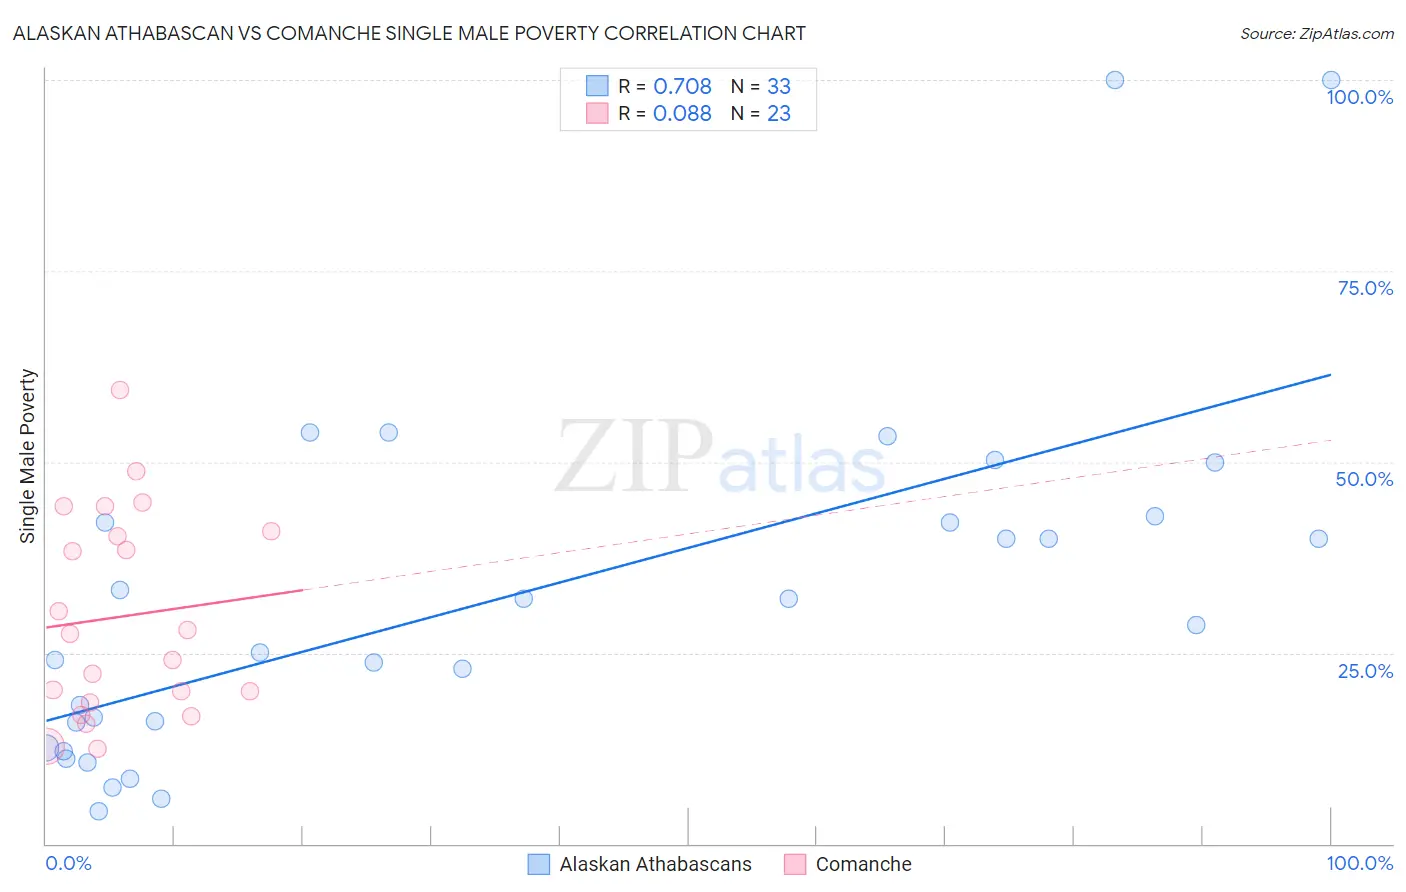
Alaskan Athabascan vs Comanche Single Male Poverty Correlation Chart
The statistical analysis conducted on geographies consisting of 44,419,805 people shows a strong positive correlation between the proportion of Alaskan Athabascans and poverty level among single males in the United States with a correlation coefficient (R) of 0.708 and weighted average of 16.1%. Similarly, the statistical analysis conducted on geographies consisting of 105,456,343 people shows a slight positive correlation between the proportion of Comanche and poverty level among single males in the United States with a correlation coefficient (R) of 0.088 and weighted average of 16.0%, a difference of 0.52%.
Single Male Poverty Correlation Summary
| Measurement | Alaskan Athabascan | Comanche |
| Minimum | 4.3% | 12.5% |
| Maximum | 100.0% | 59.4% |
| Range | 95.7% | 46.9% |
| Mean | 32.4% | 29.8% |
| Median | 28.6% | 27.4% |
| Interquartile 25% (IQ1) | 14.2% | 18.6% |
| Interquartile 75% (IQ3) | 42.5% | 40.9% |
| Interquartile Range (IQR) | 28.2% | 22.4% |
| Standard Deviation (Sample) | 23.3% | 13.3% |
| Standard Deviation (Population) | 22.9% | 13.0% |
Demographics Similar to Alaskan Athabascans and Comanche by Single Male Poverty
In terms of single male poverty, the demographic groups most similar to Alaskan Athabascans are Cheyenne (16.1%, a difference of 0.040%), Dutch West Indian (16.1%, a difference of 0.19%), Cherokee (16.1%, a difference of 0.29%), Seminole (16.0%, a difference of 0.52%), and Black/African American (16.2%, a difference of 0.53%). Similarly, the demographic groups most similar to Comanche are Seminole (16.0%, a difference of 0.0%), Cherokee (16.1%, a difference of 0.23%), Yakama (15.9%, a difference of 0.54%), Cheyenne (16.1%, a difference of 0.56%), and Dutch West Indian (16.1%, a difference of 0.71%).
| Demographics | Rating | Rank | Single Male Poverty |
| Aleuts | 0.0 /100 | #303 | Tragic 15.4% |
| Alaska Natives | 0.0 /100 | #304 | Tragic 15.4% |
| Blackfeet | 0.0 /100 | #305 | Tragic 15.5% |
| Pennsylvania Germans | 0.0 /100 | #306 | Tragic 15.6% |
| Ute | 0.0 /100 | #307 | Tragic 15.7% |
| Potawatomi | 0.0 /100 | #308 | Tragic 15.8% |
| Americans | 0.0 /100 | #309 | Tragic 15.8% |
| Yakama | 0.0 /100 | #310 | Tragic 15.9% |
| Seminole | 0.0 /100 | #311 | Tragic 16.0% |
| Comanche | 0.0 /100 | #312 | Tragic 16.0% |
| Cherokee | 0.0 /100 | #313 | Tragic 16.1% |
| Alaskan Athabascans | 0.0 /100 | #314 | Tragic 16.1% |
| Cheyenne | 0.0 /100 | #315 | Tragic 16.1% |
| Dutch West Indians | 0.0 /100 | #316 | Tragic 16.1% |
| Blacks/African Americans | 0.0 /100 | #317 | Tragic 16.2% |
| Chickasaw | 0.0 /100 | #318 | Tragic 16.3% |
| Chippewa | 0.0 /100 | #319 | Tragic 16.4% |
| Marshallese | 0.0 /100 | #320 | Tragic 16.4% |
| Osage | 0.0 /100 | #321 | Tragic 16.5% |
| Shoshone | 0.0 /100 | #322 | Tragic 16.7% |
| Creek | 0.0 /100 | #323 | Tragic 16.8% |