Alaska Native vs Dutch West Indian Male Poverty
COMPARE
Alaska Native
Dutch West Indian
Male Poverty
Male Poverty Comparison
Alaska Natives
Dutch West Indians
12.4%
MALE POVERTY
1.4/ 100
METRIC RATING
227th/ 347
METRIC RANK
14.2%
MALE POVERTY
0.0/ 100
METRIC RATING
307th/ 347
METRIC RANK
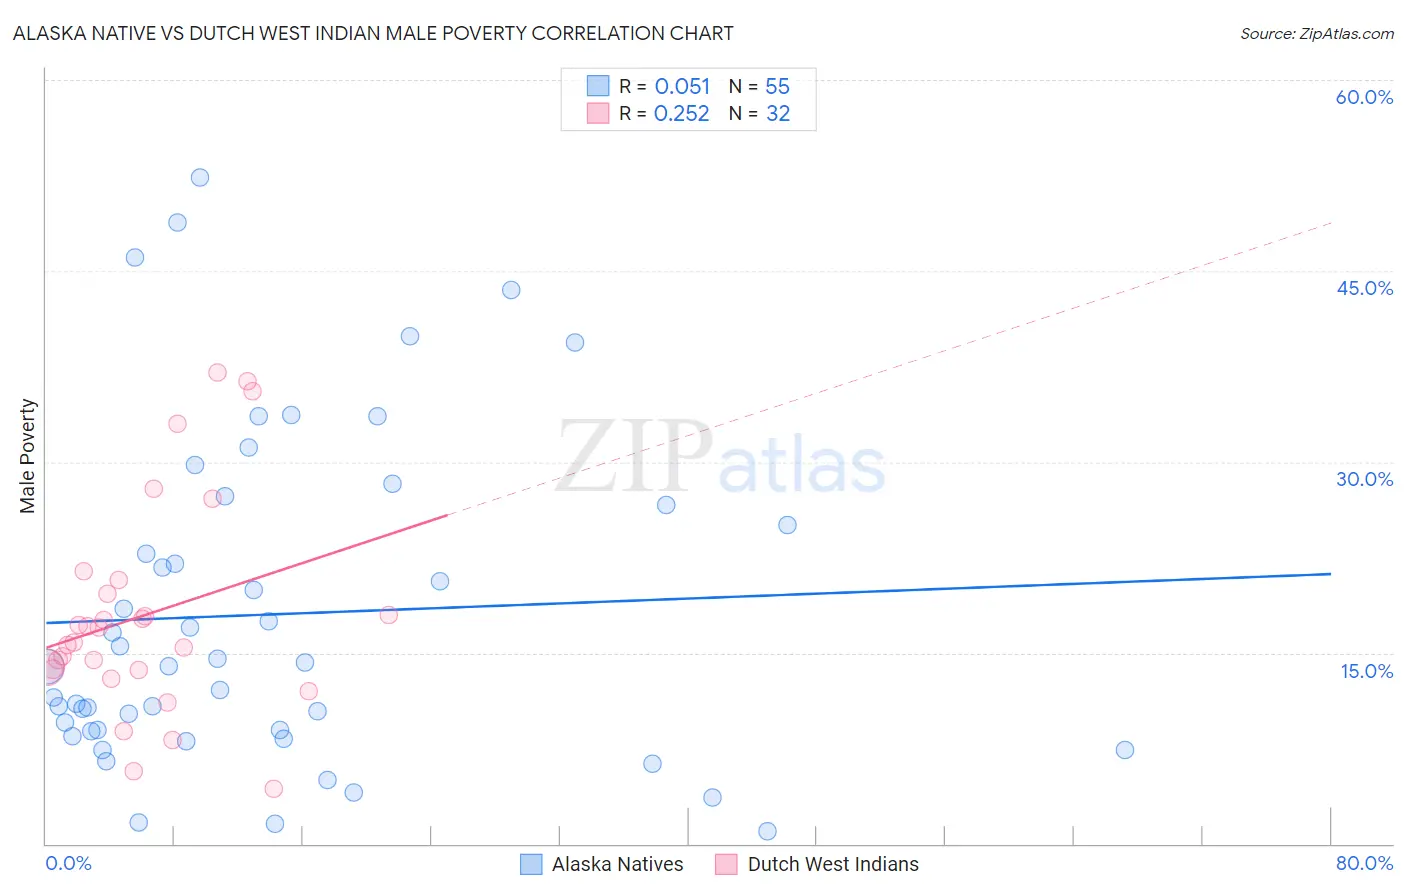
Alaska Native vs Dutch West Indian Male Poverty Correlation Chart
The statistical analysis conducted on geographies consisting of 76,750,766 people shows a slight positive correlation between the proportion of Alaska Natives and poverty level among males in the United States with a correlation coefficient (R) of 0.051 and weighted average of 12.4%. Similarly, the statistical analysis conducted on geographies consisting of 85,761,209 people shows a weak positive correlation between the proportion of Dutch West Indians and poverty level among males in the United States with a correlation coefficient (R) of 0.252 and weighted average of 14.2%, a difference of 14.9%.
Male Poverty Correlation Summary
| Measurement | Alaska Native | Dutch West Indian |
| Minimum | 0.96% | 4.3% |
| Maximum | 52.4% | 37.0% |
| Range | 51.4% | 32.7% |
| Mean | 18.0% | 18.0% |
| Median | 14.0% | 16.4% |
| Interquartile 25% (IQ1) | 8.8% | 13.7% |
| Interquartile 75% (IQ3) | 26.6% | 20.2% |
| Interquartile Range (IQR) | 17.8% | 6.5% |
| Standard Deviation (Sample) | 12.9% | 8.4% |
| Standard Deviation (Population) | 12.8% | 8.2% |
Similar Demographics by Male Poverty
Demographics Similar to Alaska Natives by Male Poverty
In terms of male poverty, the demographic groups most similar to Alaska Natives are Alsatian (12.4%, a difference of 0.040%), Nigerian (12.3%, a difference of 0.090%), Cuban (12.4%, a difference of 0.13%), Osage (12.3%, a difference of 0.26%), and Immigrants from Nigeria (12.3%, a difference of 0.32%).
| Demographics | Rating | Rank | Male Poverty |
| Immigrants | Eritrea | 2.4 /100 | #220 | Tragic 12.2% |
| Ugandans | 2.2 /100 | #221 | Tragic 12.2% |
| Immigrants | Africa | 2.1 /100 | #222 | Tragic 12.2% |
| Immigrants | Micronesia | 2.1 /100 | #223 | Tragic 12.2% |
| Immigrants | Nigeria | 1.6 /100 | #224 | Tragic 12.3% |
| Osage | 1.5 /100 | #225 | Tragic 12.3% |
| Nigerians | 1.4 /100 | #226 | Tragic 12.3% |
| Alaska Natives | 1.4 /100 | #227 | Tragic 12.4% |
| Alsatians | 1.3 /100 | #228 | Tragic 12.4% |
| Cubans | 1.3 /100 | #229 | Tragic 12.4% |
| Marshallese | 0.8 /100 | #230 | Tragic 12.5% |
| Salvadorans | 0.6 /100 | #231 | Tragic 12.6% |
| Nicaraguans | 0.6 /100 | #232 | Tragic 12.6% |
| Fijians | 0.6 /100 | #233 | Tragic 12.6% |
| Immigrants | Armenia | 0.6 /100 | #234 | Tragic 12.6% |
Demographics Similar to Dutch West Indians by Male Poverty
In terms of male poverty, the demographic groups most similar to Dutch West Indians are African (14.2%, a difference of 0.020%), Somali (14.3%, a difference of 0.40%), Seminole (14.3%, a difference of 0.60%), Creek (14.1%, a difference of 0.70%), and Immigrants from Bangladesh (14.1%, a difference of 0.77%).
| Demographics | Rating | Rank | Male Poverty |
| Immigrants | Mexico | 0.0 /100 | #300 | Tragic 14.0% |
| Immigrants | Senegal | 0.0 /100 | #301 | Tragic 14.0% |
| Immigrants | Caribbean | 0.0 /100 | #302 | Tragic 14.0% |
| Bahamians | 0.0 /100 | #303 | Tragic 14.1% |
| Senegalese | 0.0 /100 | #304 | Tragic 14.1% |
| Immigrants | Bangladesh | 0.0 /100 | #305 | Tragic 14.1% |
| Creek | 0.0 /100 | #306 | Tragic 14.1% |
| Dutch West Indians | 0.0 /100 | #307 | Tragic 14.2% |
| Africans | 0.0 /100 | #308 | Tragic 14.2% |
| Somalis | 0.0 /100 | #309 | Tragic 14.3% |
| Seminole | 0.0 /100 | #310 | Tragic 14.3% |
| Hondurans | 0.0 /100 | #311 | Tragic 14.3% |
| Choctaw | 0.0 /100 | #312 | Tragic 14.4% |
| Immigrants | Somalia | 0.0 /100 | #313 | Tragic 14.6% |
| Immigrants | Honduras | 0.0 /100 | #314 | Tragic 14.6% |