Zip Codes with the Most Immigrants from Eastern Asia in Bowling Green, OH
RELATED REPORTS & OPTIONS
Eastern Asia
Bowling Green
Compare Zip Codes
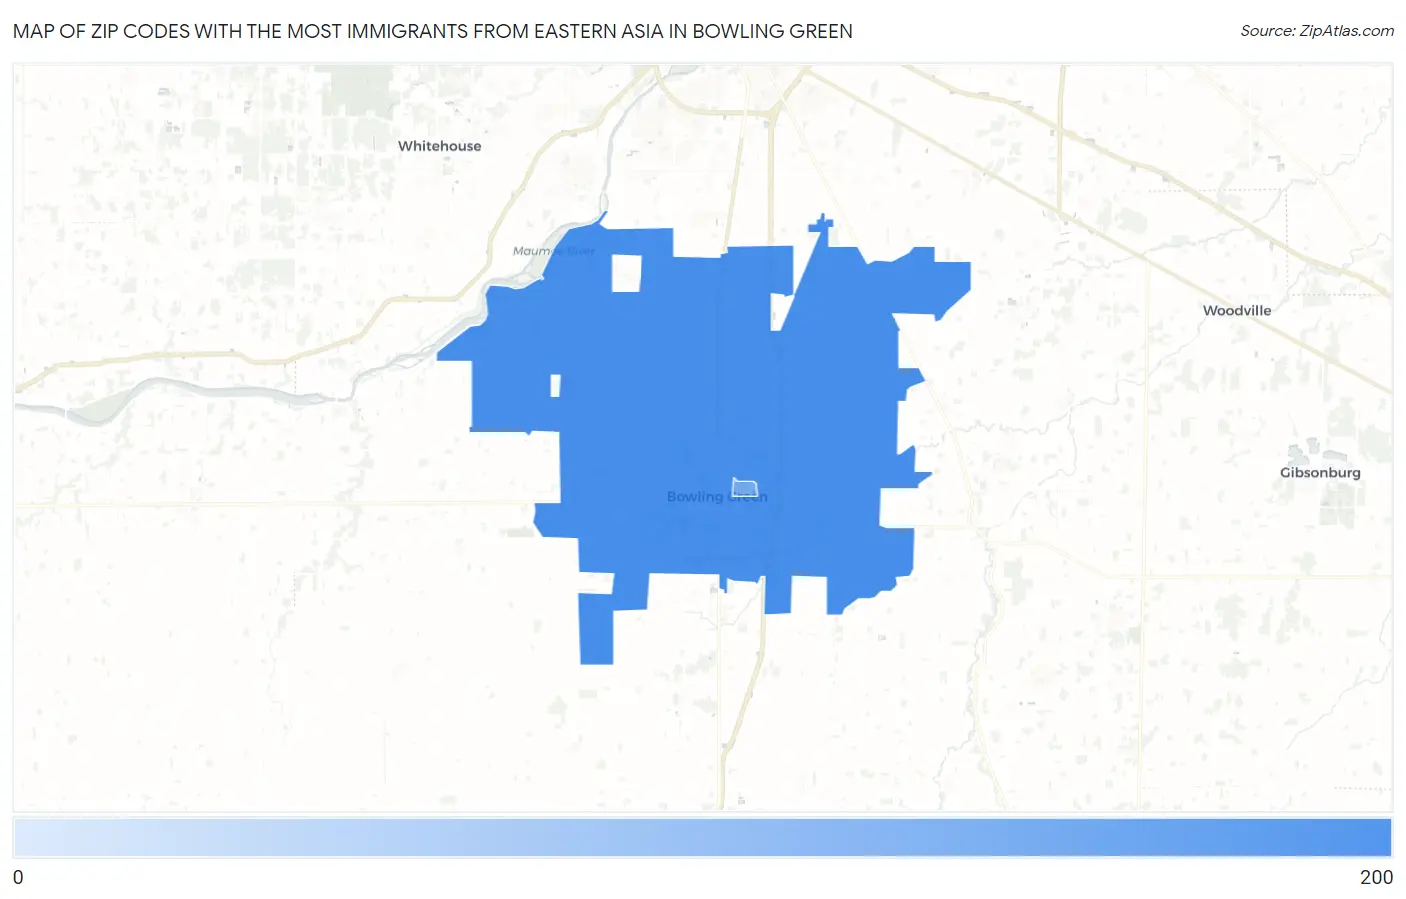
Map of Zip Codes with the Most Immigrants from Eastern Asia in Bowling Green
41
198
Zip Codes with the Most Immigrants from Eastern Asia in Bowling Green, OH
| Zip Code | Eastern Asia | vs State | vs National | |
| 1. | 43402 | 198 | 61,186(0.32%)#80 | 4,223,726(0.00%)#3,593 |
| 2. | 43403 | 41 | 61,186(0.07%)#239 | 4,223,726(0.00%)#7,743 |
1
Common Questions
What are the Top Zip Codes with the Most Immigrants from Eastern Asia in Bowling Green, OH?
Top Zip Codes with the Most Immigrants from Eastern Asia in Bowling Green, OH are:
What zip code has the Most Immigrants from Eastern Asia in Bowling Green, OH?
43402 has the Most Immigrants from Eastern Asia in Bowling Green, OH with 198.
What is the Total Immigrants from Eastern Asia in Bowling Green, OH?
Total Immigrants from Eastern Asia in Bowling Green is 230.
What is the Total Immigrants from Eastern Asia in Ohio?
Total Immigrants from Eastern Asia in Ohio is 61,186.
What is the Total Immigrants from Eastern Asia in the United States?
Total Immigrants from Eastern Asia in the United States is 4,223,726.