Zip Codes with the Highest Percentage of Population Taking Taxi / Cab to Work in Reno, NV
RELATED REPORTS & OPTIONS
Taxi / Cab
Reno
Compare Zip Codes
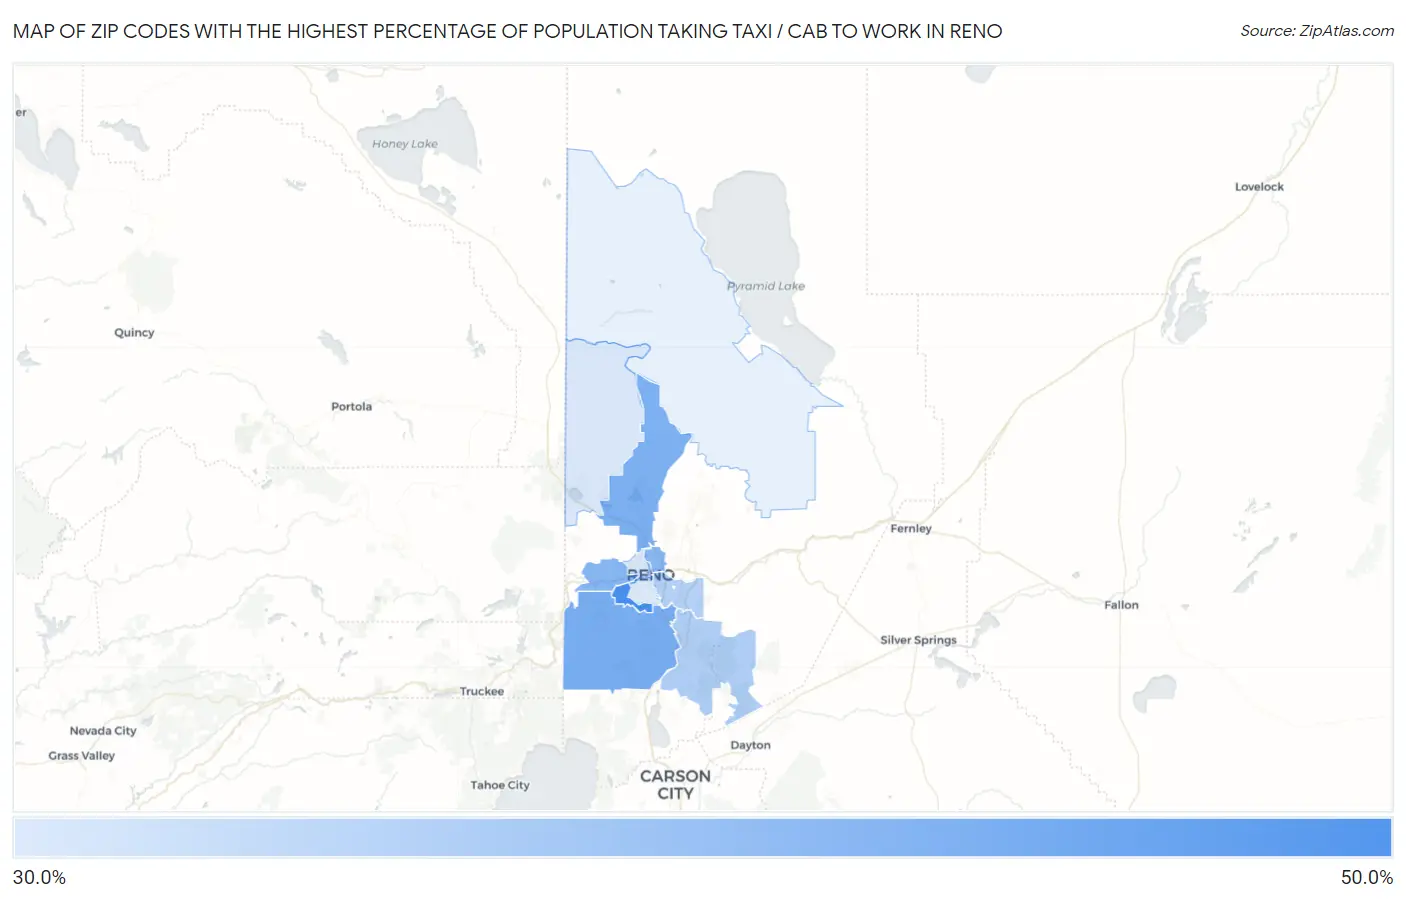
Map of Zip Codes with the Highest Percentage of Population Taking Taxi / Cab to Work in Reno
30.3%
49.9%
Zip Codes with the Highest Percentage of Population Taking Taxi / Cab to Work in Reno, NV
| Zip Code | % Take Taxi / Cab | vs State | vs National | |
| 1. | 89519 | 49.9% | 38.4%(+11.5)#18 | 38.2%(+11.7)#2,997 |
| 2. | 89511 | 43.3% | 38.4%(+4.90)#31 | 38.2%(+5.10)#5,254 |
| 3. | 89506 | 42.7% | 38.4%(+4.30)#33 | 38.2%(+4.50)#5,428 |
| 4. | 89523 | 41.0% | 38.4%(+2.60)#38 | 38.2%(+2.80)#6,144 |
| 5. | 89512 | 40.9% | 38.4%(+2.50)#39 | 38.2%(+2.70)#6,195 |
| 6. | 89521 | 35.9% | 38.4%(-2.50)#55 | 38.2%(-2.30)#8,452 |
| 7. | 89502 | 35.5% | 38.4%(-2.90)#60 | 38.2%(-2.70)#8,651 |
| 8. | 89501 | 31.2% | 38.4%(-7.20)#79 | 38.2%(-7.00)#10,481 |
| 9. | 89508 | 30.9% | 38.4%(-7.50)#80 | 38.2%(-7.30)#10,574 |
| 10. | 89503 | 30.6% | 38.4%(-7.80)#81 | 38.2%(-7.60)#10,714 |
| 11. | 89509 | 30.3% | 38.4%(-8.10)#82 | 38.2%(-7.90)#10,816 |
1
Common Questions
What are the Top 10 Zip Codes with the Highest Percentage of Population Taking Taxi / Cab to Work in Reno, NV?
Top 10 Zip Codes with the Highest Percentage of Population Taking Taxi / Cab to Work in Reno, NV are:
What zip code has the Highest Percentage of Population Taking Taxi / Cab to Work in Reno, NV?
89519 has the Highest Percentage of Population Taking Taxi / Cab to Work in Reno, NV with 49.9%.
What is the Percentage of Population Taking Taxi / Cab to Work in Reno, NV?
Percentage of Population Taking Taxi / Cab to Work in Reno is 35.9%.
What is the Percentage of Population Taking Taxi / Cab to Work in Nevada?
Percentage of Population Taking Taxi / Cab to Work in Nevada is 38.4%.
What is the Percentage of Population Taking Taxi / Cab to Work in the United States?
Percentage of Population Taking Taxi / Cab to Work in the United States is 38.2%.