Zip Codes with the Highest Percentage of Population Employed in Agriculture, Fishing & Hunting in Moss Point, MS
RELATED REPORTS & OPTIONS
Agriculture, Fishing & Hunting
Moss Point
Compare Zip Codes
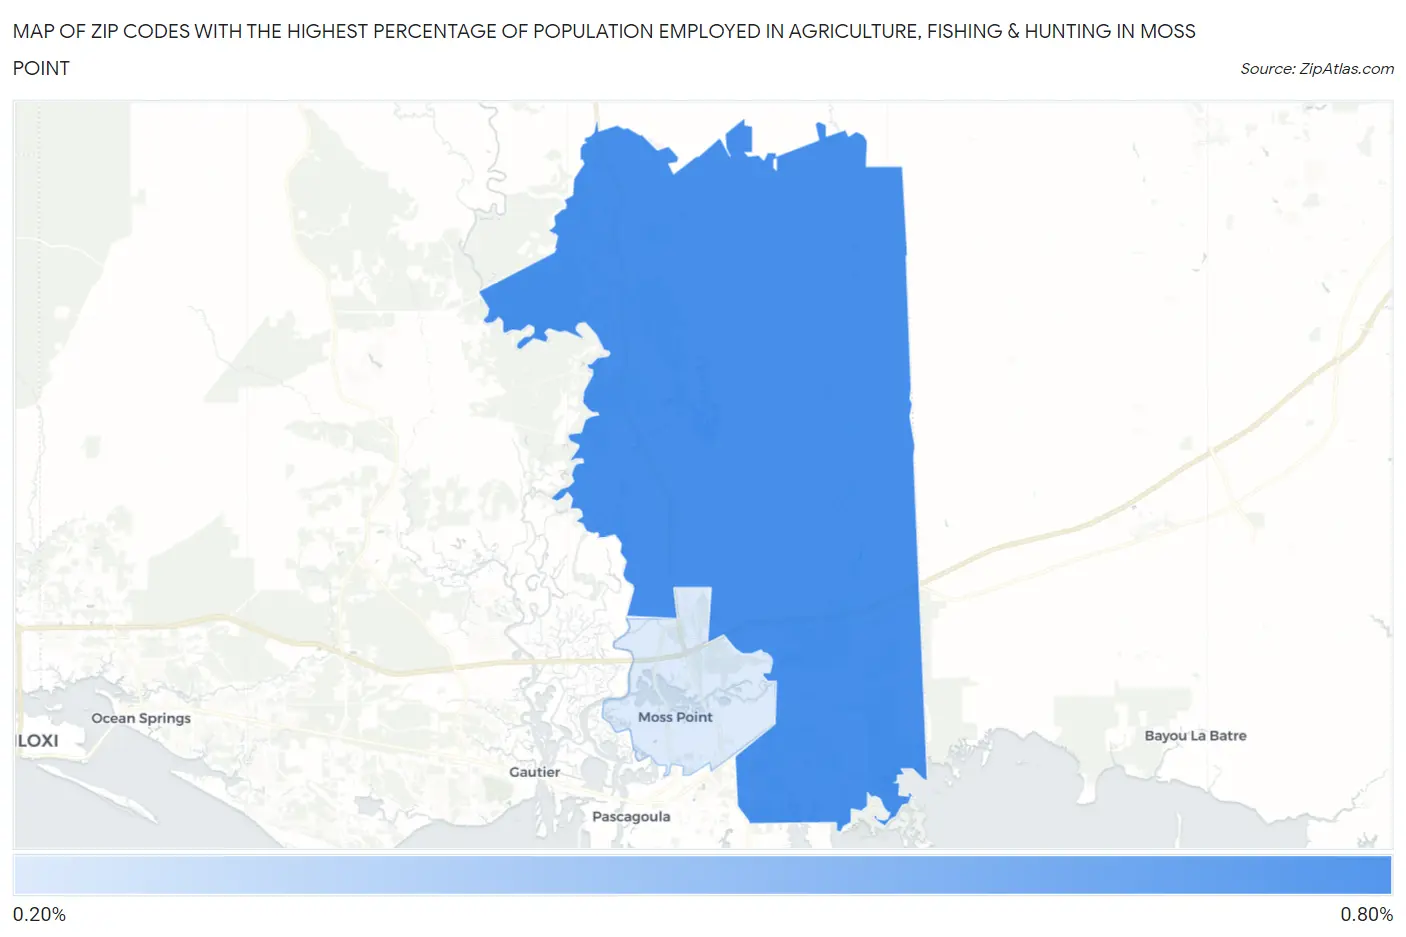
Map of Zip Codes with the Highest Percentage of Population Employed in Agriculture, Fishing & Hunting in Moss Point
0.24%
0.71%
Zip Codes with the Highest Percentage of Population Employed in Agriculture, Fishing & Hunting in Moss Point, MS
| Zip Code | % Employed | vs State | vs National | |
| 1. | 39562 | 0.71% | 1.6%(-0.836)#240 | 1.2%(-0.486)#17,774 |
| 2. | 39563 | 0.24% | 1.6%(-1.31)#284 | 1.2%(-0.963)#21,919 |
1
Common Questions
What are the Top Zip Codes with the Highest Percentage of Population Employed in Agriculture, Fishing & Hunting in Moss Point, MS?
Top Zip Codes with the Highest Percentage of Population Employed in Agriculture, Fishing & Hunting in Moss Point, MS are:
What zip code has the Highest Percentage of Population Employed in Agriculture, Fishing & Hunting in Moss Point, MS?
39562 has the Highest Percentage of Population Employed in Agriculture, Fishing & Hunting in Moss Point, MS with 0.71%.
What is the Percentage of Population Employed in Agriculture, Fishing & Hunting in Moss Point, MS?
Percentage of Population Employed in Agriculture, Fishing & Hunting in Moss Point is 0.24%.
What is the Percentage of Population Employed in Agriculture, Fishing & Hunting in Mississippi?
Percentage of Population Employed in Agriculture, Fishing & Hunting in Mississippi is 1.6%.
What is the Percentage of Population Employed in Agriculture, Fishing & Hunting in the United States?
Percentage of Population Employed in Agriculture, Fishing & Hunting in the United States is 1.2%.