Hispanic or Latino vs Afghan In Labor Force | Age 25-29
COMPARE
Hispanic or Latino
Afghan
In Labor Force | Age 25-29
In Labor Force | Age 25-29 Comparison
Hispanics or Latinos
Afghans
82.2%
IN LABOR FORCE | AGE 25-29
0.0/ 100
METRIC RATING
312th/ 347
METRIC RANK
84.4%
IN LABOR FORCE | AGE 25-29
15.9/ 100
METRIC RATING
202nd/ 347
METRIC RANK
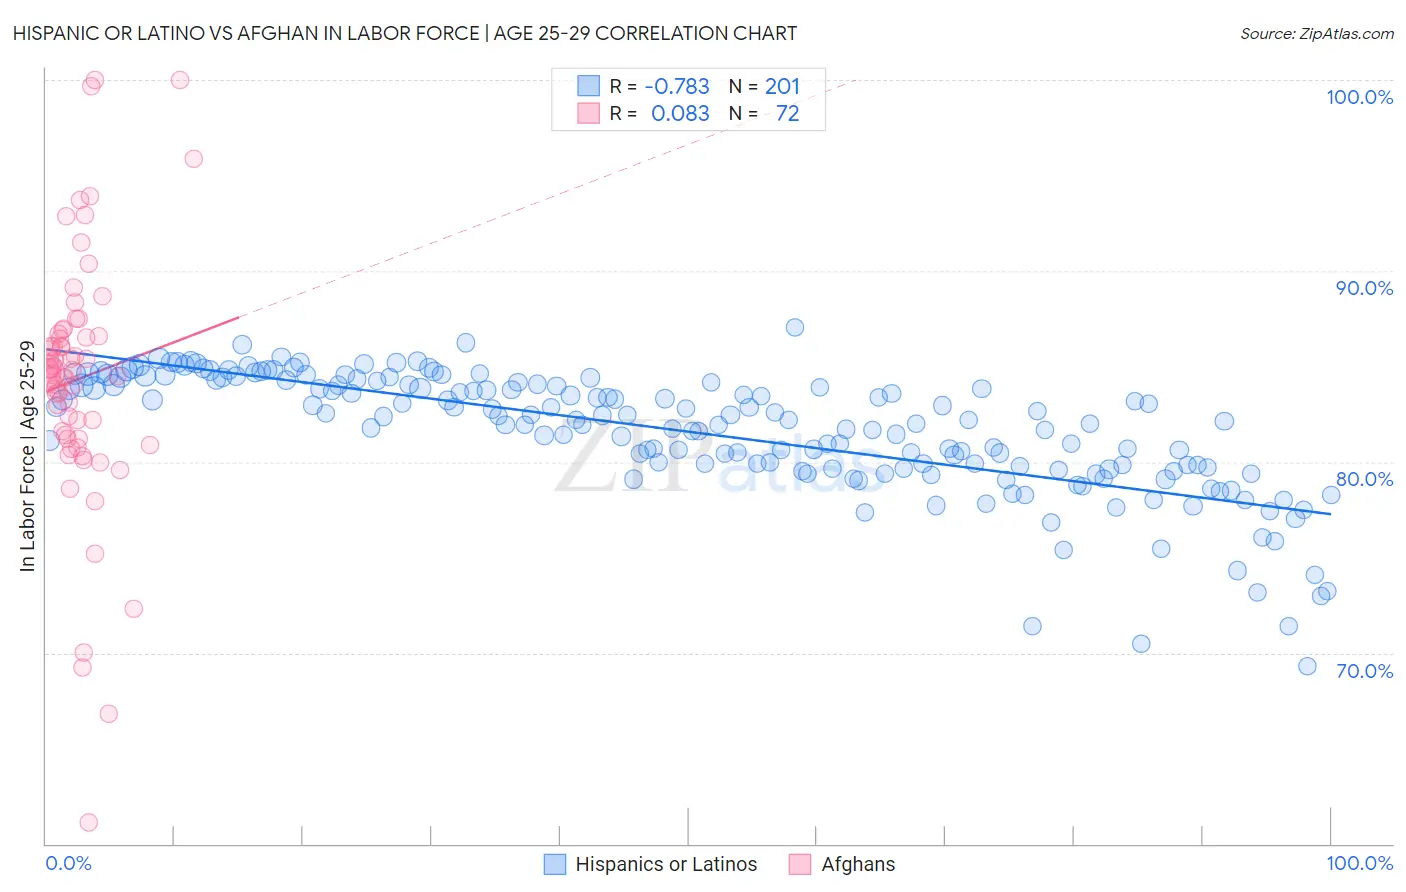
Hispanic or Latino vs Afghan In Labor Force | Age 25-29 Correlation Chart
The statistical analysis conducted on geographies consisting of 577,042,190 people shows a strong negative correlation between the proportion of Hispanics or Latinos and labor force participation rate among population between the ages 25 and 29 in the United States with a correlation coefficient (R) of -0.783 and weighted average of 82.2%. Similarly, the statistical analysis conducted on geographies consisting of 148,868,617 people shows a slight positive correlation between the proportion of Afghans and labor force participation rate among population between the ages 25 and 29 in the United States with a correlation coefficient (R) of 0.083 and weighted average of 84.4%, a difference of 2.6%.
In Labor Force | Age 25-29 Correlation Summary
| Measurement | Hispanic or Latino | Afghan |
| Minimum | 69.3% | 61.1% |
| Maximum | 87.0% | 100.0% |
| Range | 17.7% | 38.9% |
| Mean | 81.6% | 84.3% |
| Median | 82.2% | 84.7% |
| Interquartile 25% (IQ1) | 79.7% | 81.3% |
| Interquartile 75% (IQ3) | 84.1% | 86.7% |
| Interquartile Range (IQR) | 4.4% | 5.4% |
| Standard Deviation (Sample) | 3.2% | 6.7% |
| Standard Deviation (Population) | 3.2% | 6.6% |
Similar Demographics by In Labor Force | Age 25-29
Demographics Similar to Hispanics or Latinos by In Labor Force | Age 25-29
In terms of in labor force | age 25-29, the demographic groups most similar to Hispanics or Latinos are Alaskan Athabascan (82.3%, a difference of 0.070%), Osage (82.3%, a difference of 0.080%), Yaqui (82.2%, a difference of 0.10%), Cherokee (82.1%, a difference of 0.14%), and Immigrants from Central America (82.4%, a difference of 0.21%).
| Demographics | Rating | Rank | In Labor Force | Age 25-29 |
| Blacks/African Americans | 0.0 /100 | #305 | Tragic 82.6% |
| Blackfeet | 0.0 /100 | #306 | Tragic 82.6% |
| Cajuns | 0.0 /100 | #307 | Tragic 82.5% |
| Central American Indians | 0.0 /100 | #308 | Tragic 82.4% |
| Immigrants | Central America | 0.0 /100 | #309 | Tragic 82.4% |
| Osage | 0.0 /100 | #310 | Tragic 82.3% |
| Alaskan Athabascans | 0.0 /100 | #311 | Tragic 82.3% |
| Hispanics or Latinos | 0.0 /100 | #312 | Tragic 82.2% |
| Yaqui | 0.0 /100 | #313 | Tragic 82.2% |
| Cherokee | 0.0 /100 | #314 | Tragic 82.1% |
| Immigrants | Mexico | 0.0 /100 | #315 | Tragic 82.0% |
| Mexicans | 0.0 /100 | #316 | Tragic 81.9% |
| Chickasaw | 0.0 /100 | #317 | Tragic 81.9% |
| Comanche | 0.0 /100 | #318 | Tragic 81.9% |
| Seminole | 0.0 /100 | #319 | Tragic 81.7% |
Demographics Similar to Afghans by In Labor Force | Age 25-29
In terms of in labor force | age 25-29, the demographic groups most similar to Afghans are Immigrants from Afghanistan (84.4%, a difference of 0.0%), Laotian (84.4%, a difference of 0.010%), Venezuelan (84.4%, a difference of 0.010%), Immigrants from Kazakhstan (84.4%, a difference of 0.020%), and Ecuadorian (84.4%, a difference of 0.020%).
| Demographics | Rating | Rank | In Labor Force | Age 25-29 |
| Immigrants | Israel | 20.8 /100 | #195 | Fair 84.4% |
| Immigrants | South Eastern Asia | 19.5 /100 | #196 | Poor 84.4% |
| Tlingit-Haida | 19.3 /100 | #197 | Poor 84.4% |
| Immigrants | Iraq | 19.0 /100 | #198 | Poor 84.4% |
| Immigrants | Germany | 18.3 /100 | #199 | Poor 84.4% |
| Immigrants | Kazakhstan | 17.5 /100 | #200 | Poor 84.4% |
| Laotians | 16.6 /100 | #201 | Poor 84.4% |
| Afghans | 15.9 /100 | #202 | Poor 84.4% |
| Immigrants | Afghanistan | 15.6 /100 | #203 | Poor 84.4% |
| Venezuelans | 15.1 /100 | #204 | Poor 84.4% |
| Ecuadorians | 14.8 /100 | #205 | Poor 84.4% |
| Immigrants | Cambodia | 14.3 /100 | #206 | Poor 84.4% |
| Immigrants | Armenia | 13.3 /100 | #207 | Poor 84.4% |
| Immigrants | Indonesia | 13.2 /100 | #208 | Poor 84.4% |
| Immigrants | Jordan | 12.8 /100 | #209 | Poor 84.4% |