Immigrants from Eritrea vs Afghan In Labor Force | Age 25-29
COMPARE
Immigrants from Eritrea
Afghan
In Labor Force | Age 25-29
In Labor Force | Age 25-29 Comparison
Immigrants from Eritrea
Afghans
85.7%
IN LABOR FORCE | AGE 25-29
99.9/ 100
METRIC RATING
42nd/ 347
METRIC RANK
84.4%
IN LABOR FORCE | AGE 25-29
15.9/ 100
METRIC RATING
202nd/ 347
METRIC RANK
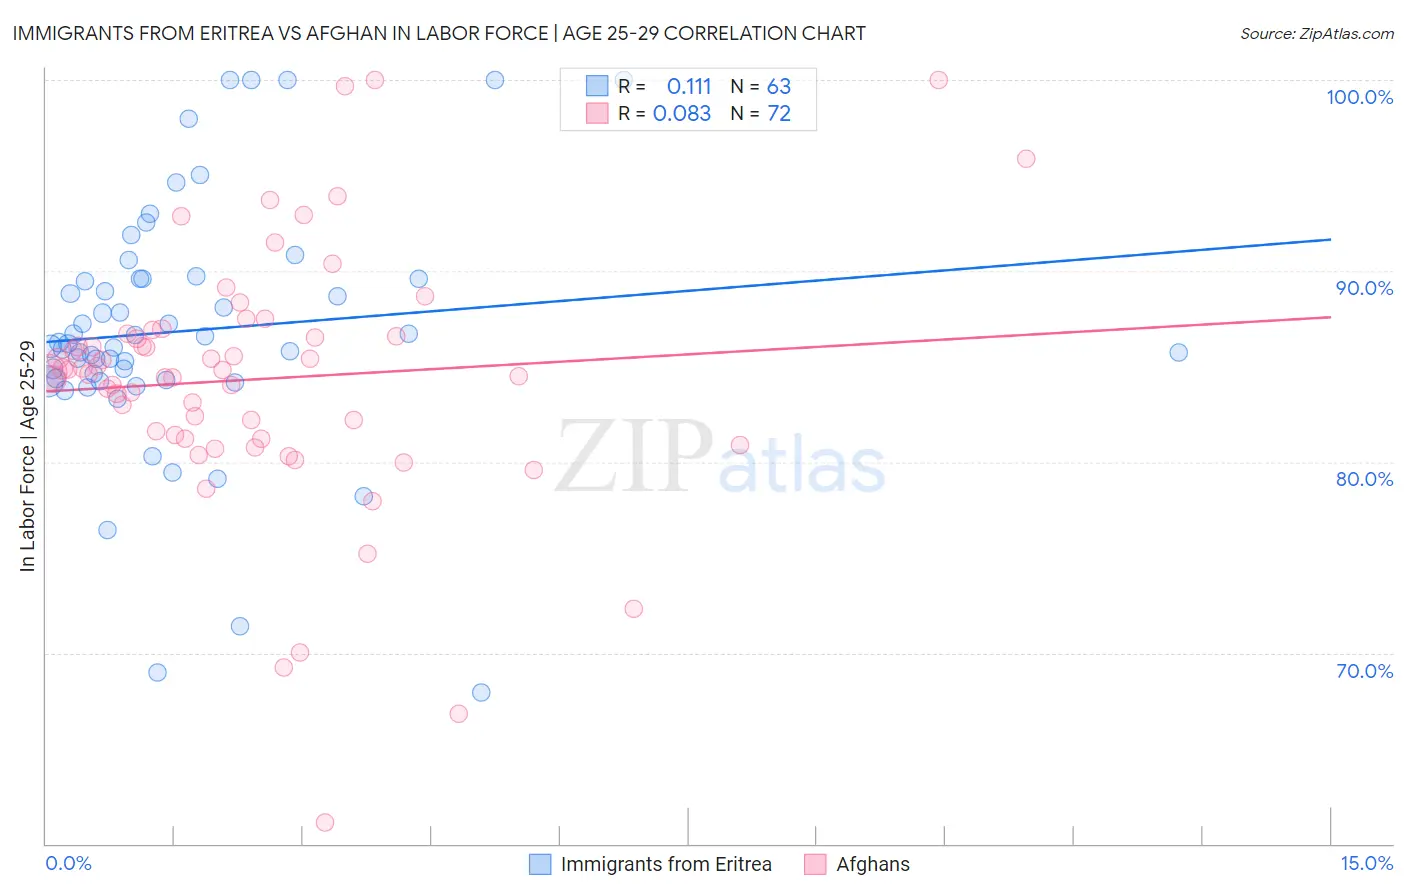
Immigrants from Eritrea vs Afghan In Labor Force | Age 25-29 Correlation Chart
The statistical analysis conducted on geographies consisting of 104,848,070 people shows a poor positive correlation between the proportion of Immigrants from Eritrea and labor force participation rate among population between the ages 25 and 29 in the United States with a correlation coefficient (R) of 0.111 and weighted average of 85.7%. Similarly, the statistical analysis conducted on geographies consisting of 148,868,617 people shows a slight positive correlation between the proportion of Afghans and labor force participation rate among population between the ages 25 and 29 in the United States with a correlation coefficient (R) of 0.083 and weighted average of 84.4%, a difference of 1.5%.
In Labor Force | Age 25-29 Correlation Summary
| Measurement | Immigrants from Eritrea | Afghan |
| Minimum | 67.9% | 61.1% |
| Maximum | 100.0% | 100.0% |
| Range | 32.1% | 38.9% |
| Mean | 86.9% | 84.3% |
| Median | 86.2% | 84.7% |
| Interquartile 25% (IQ1) | 84.3% | 81.3% |
| Interquartile 75% (IQ3) | 89.6% | 86.7% |
| Interquartile Range (IQR) | 5.3% | 5.4% |
| Standard Deviation (Sample) | 6.5% | 6.7% |
| Standard Deviation (Population) | 6.5% | 6.6% |
Similar Demographics by In Labor Force | Age 25-29
Demographics Similar to Immigrants from Eritrea by In Labor Force | Age 25-29
In terms of in labor force | age 25-29, the demographic groups most similar to Immigrants from Eritrea are Immigrants from India (85.7%, a difference of 0.010%), Macedonian (85.7%, a difference of 0.020%), Immigrants from Sierra Leone (85.7%, a difference of 0.020%), Immigrants from Greece (85.7%, a difference of 0.040%), and Immigrants from Albania (85.7%, a difference of 0.050%).
| Demographics | Rating | Rank | In Labor Force | Age 25-29 |
| Cypriots | 99.9 /100 | #35 | Exceptional 85.8% |
| Immigrants | Nepal | 99.9 /100 | #36 | Exceptional 85.8% |
| Poles | 99.9 /100 | #37 | Exceptional 85.8% |
| Sierra Leoneans | 99.9 /100 | #38 | Exceptional 85.8% |
| Croatians | 99.9 /100 | #39 | Exceptional 85.8% |
| Immigrants | Albania | 99.9 /100 | #40 | Exceptional 85.7% |
| Immigrants | Greece | 99.9 /100 | #41 | Exceptional 85.7% |
| Immigrants | Eritrea | 99.9 /100 | #42 | Exceptional 85.7% |
| Immigrants | India | 99.9 /100 | #43 | Exceptional 85.7% |
| Macedonians | 99.9 /100 | #44 | Exceptional 85.7% |
| Immigrants | Sierra Leone | 99.9 /100 | #45 | Exceptional 85.7% |
| Czechs | 99.8 /100 | #46 | Exceptional 85.6% |
| Turks | 99.8 /100 | #47 | Exceptional 85.6% |
| Italians | 99.8 /100 | #48 | Exceptional 85.6% |
| Swedes | 99.8 /100 | #49 | Exceptional 85.6% |
Demographics Similar to Afghans by In Labor Force | Age 25-29
In terms of in labor force | age 25-29, the demographic groups most similar to Afghans are Immigrants from Afghanistan (84.4%, a difference of 0.0%), Laotian (84.4%, a difference of 0.010%), Venezuelan (84.4%, a difference of 0.010%), Immigrants from Kazakhstan (84.4%, a difference of 0.020%), and Ecuadorian (84.4%, a difference of 0.020%).
| Demographics | Rating | Rank | In Labor Force | Age 25-29 |
| Immigrants | Israel | 20.8 /100 | #195 | Fair 84.4% |
| Immigrants | South Eastern Asia | 19.5 /100 | #196 | Poor 84.4% |
| Tlingit-Haida | 19.3 /100 | #197 | Poor 84.4% |
| Immigrants | Iraq | 19.0 /100 | #198 | Poor 84.4% |
| Immigrants | Germany | 18.3 /100 | #199 | Poor 84.4% |
| Immigrants | Kazakhstan | 17.5 /100 | #200 | Poor 84.4% |
| Laotians | 16.6 /100 | #201 | Poor 84.4% |
| Afghans | 15.9 /100 | #202 | Poor 84.4% |
| Immigrants | Afghanistan | 15.6 /100 | #203 | Poor 84.4% |
| Venezuelans | 15.1 /100 | #204 | Poor 84.4% |
| Ecuadorians | 14.8 /100 | #205 | Poor 84.4% |
| Immigrants | Cambodia | 14.3 /100 | #206 | Poor 84.4% |
| Immigrants | Armenia | 13.3 /100 | #207 | Poor 84.4% |
| Immigrants | Indonesia | 13.2 /100 | #208 | Poor 84.4% |
| Immigrants | Jordan | 12.8 /100 | #209 | Poor 84.4% |