Senegalese vs Afghan In Labor Force | Age 25-29
COMPARE
Senegalese
Afghan
In Labor Force | Age 25-29
In Labor Force | Age 25-29 Comparison
Senegalese
Afghans
85.0%
IN LABOR FORCE | AGE 25-29
90.9/ 100
METRIC RATING
112th/ 347
METRIC RANK
84.4%
IN LABOR FORCE | AGE 25-29
15.9/ 100
METRIC RATING
202nd/ 347
METRIC RANK
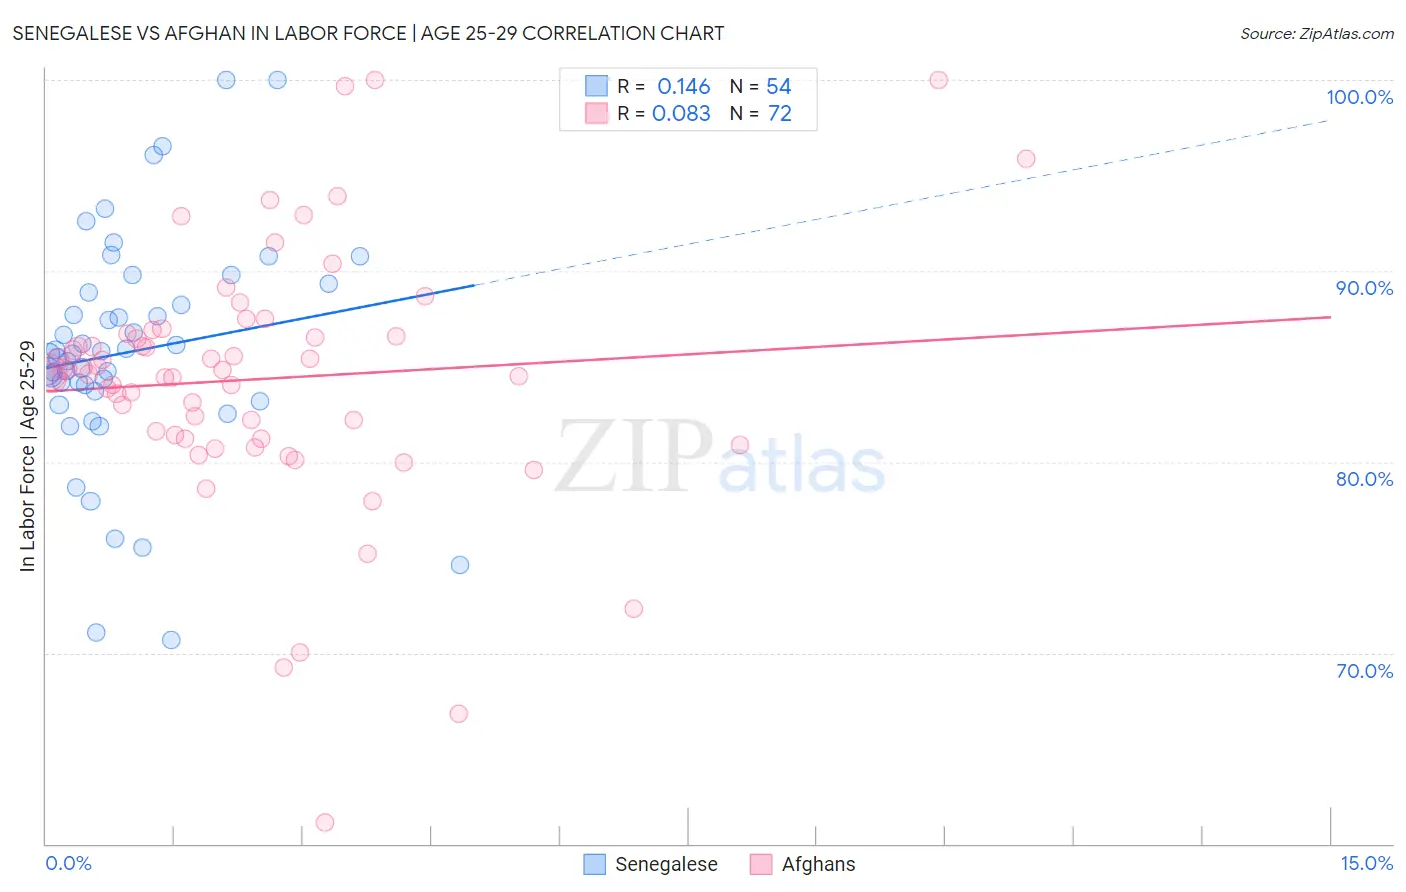
Senegalese vs Afghan In Labor Force | Age 25-29 Correlation Chart
The statistical analysis conducted on geographies consisting of 78,132,708 people shows a poor positive correlation between the proportion of Senegalese and labor force participation rate among population between the ages 25 and 29 in the United States with a correlation coefficient (R) of 0.146 and weighted average of 85.0%. Similarly, the statistical analysis conducted on geographies consisting of 148,868,617 people shows a slight positive correlation between the proportion of Afghans and labor force participation rate among population between the ages 25 and 29 in the United States with a correlation coefficient (R) of 0.083 and weighted average of 84.4%, a difference of 0.73%.
In Labor Force | Age 25-29 Correlation Summary
| Measurement | Senegalese | Afghan |
| Minimum | 70.7% | 61.1% |
| Maximum | 100.0% | 100.0% |
| Range | 29.3% | 38.9% |
| Mean | 85.8% | 84.3% |
| Median | 85.7% | 84.7% |
| Interquartile 25% (IQ1) | 83.7% | 81.3% |
| Interquartile 75% (IQ3) | 88.9% | 86.7% |
| Interquartile Range (IQR) | 5.2% | 5.4% |
| Standard Deviation (Sample) | 6.0% | 6.7% |
| Standard Deviation (Population) | 5.9% | 6.6% |
Similar Demographics by In Labor Force | Age 25-29
Demographics Similar to Senegalese by In Labor Force | Age 25-29
In terms of in labor force | age 25-29, the demographic groups most similar to Senegalese are New Zealander (85.0%, a difference of 0.010%), Immigrants from Middle Africa (85.0%, a difference of 0.010%), Irish (85.0%, a difference of 0.010%), Immigrants from Malaysia (85.0%, a difference of 0.010%), and Immigrants from Austria (85.0%, a difference of 0.020%).
| Demographics | Rating | Rank | In Labor Force | Age 25-29 |
| Immigrants | Hong Kong | 92.8 /100 | #105 | Exceptional 85.0% |
| Czechoslovakians | 92.6 /100 | #106 | Exceptional 85.0% |
| Immigrants | Southern Europe | 92.3 /100 | #107 | Exceptional 85.0% |
| Immigrants | Austria | 91.9 /100 | #108 | Exceptional 85.0% |
| Costa Ricans | 91.9 /100 | #109 | Exceptional 85.0% |
| New Zealanders | 91.5 /100 | #110 | Exceptional 85.0% |
| Immigrants | Middle Africa | 91.4 /100 | #111 | Exceptional 85.0% |
| Senegalese | 90.9 /100 | #112 | Exceptional 85.0% |
| Irish | 90.6 /100 | #113 | Exceptional 85.0% |
| Immigrants | Malaysia | 90.4 /100 | #114 | Exceptional 85.0% |
| South Africans | 88.9 /100 | #115 | Excellent 85.0% |
| Chileans | 88.8 /100 | #116 | Excellent 85.0% |
| Immigrants | Belarus | 88.0 /100 | #117 | Excellent 85.0% |
| Finns | 87.8 /100 | #118 | Excellent 85.0% |
| Filipinos | 87.1 /100 | #119 | Excellent 84.9% |
Demographics Similar to Afghans by In Labor Force | Age 25-29
In terms of in labor force | age 25-29, the demographic groups most similar to Afghans are Immigrants from Afghanistan (84.4%, a difference of 0.0%), Laotian (84.4%, a difference of 0.010%), Venezuelan (84.4%, a difference of 0.010%), Immigrants from Kazakhstan (84.4%, a difference of 0.020%), and Ecuadorian (84.4%, a difference of 0.020%).
| Demographics | Rating | Rank | In Labor Force | Age 25-29 |
| Immigrants | Israel | 20.8 /100 | #195 | Fair 84.4% |
| Immigrants | South Eastern Asia | 19.5 /100 | #196 | Poor 84.4% |
| Tlingit-Haida | 19.3 /100 | #197 | Poor 84.4% |
| Immigrants | Iraq | 19.0 /100 | #198 | Poor 84.4% |
| Immigrants | Germany | 18.3 /100 | #199 | Poor 84.4% |
| Immigrants | Kazakhstan | 17.5 /100 | #200 | Poor 84.4% |
| Laotians | 16.6 /100 | #201 | Poor 84.4% |
| Afghans | 15.9 /100 | #202 | Poor 84.4% |
| Immigrants | Afghanistan | 15.6 /100 | #203 | Poor 84.4% |
| Venezuelans | 15.1 /100 | #204 | Poor 84.4% |
| Ecuadorians | 14.8 /100 | #205 | Poor 84.4% |
| Immigrants | Cambodia | 14.3 /100 | #206 | Poor 84.4% |
| Immigrants | Armenia | 13.3 /100 | #207 | Poor 84.4% |
| Immigrants | Indonesia | 13.2 /100 | #208 | Poor 84.4% |
| Immigrants | Jordan | 12.8 /100 | #209 | Poor 84.4% |