Scotch-Irish vs Puerto Rican In Labor Force | Age 25-29
COMPARE
Scotch-Irish
Puerto Rican
In Labor Force | Age 25-29
In Labor Force | Age 25-29 Comparison
Scotch-Irish
Puerto Ricans
84.2%
IN LABOR FORCE | AGE 25-29
6.5/ 100
METRIC RATING
223rd/ 347
METRIC RANK
80.4%
IN LABOR FORCE | AGE 25-29
0.0/ 100
METRIC RATING
330th/ 347
METRIC RANK
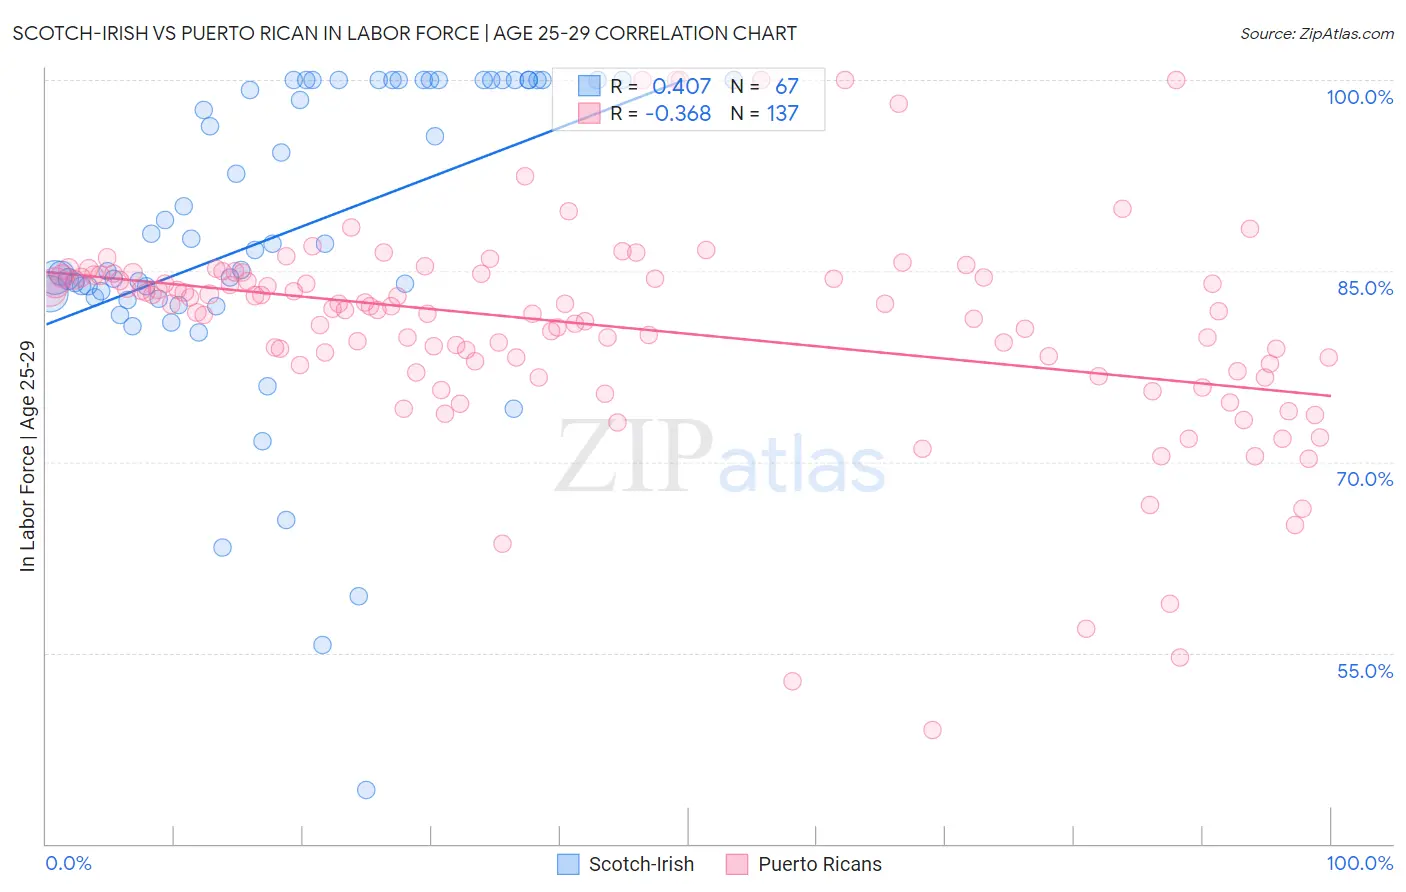
Scotch-Irish vs Puerto Rican In Labor Force | Age 25-29 Correlation Chart
The statistical analysis conducted on geographies consisting of 547,797,884 people shows a moderate positive correlation between the proportion of Scotch-Irish and labor force participation rate among population between the ages 25 and 29 in the United States with a correlation coefficient (R) of 0.407 and weighted average of 84.2%. Similarly, the statistical analysis conducted on geographies consisting of 527,795,348 people shows a mild negative correlation between the proportion of Puerto Ricans and labor force participation rate among population between the ages 25 and 29 in the United States with a correlation coefficient (R) of -0.368 and weighted average of 80.4%, a difference of 4.8%.
In Labor Force | Age 25-29 Correlation Summary
| Measurement | Scotch-Irish | Puerto Rican |
| Minimum | 44.2% | 48.9% |
| Maximum | 100.0% | 100.0% |
| Range | 55.8% | 51.1% |
| Mean | 88.0% | 80.7% |
| Median | 87.1% | 82.2% |
| Interquartile 25% (IQ1) | 82.9% | 77.7% |
| Interquartile 75% (IQ3) | 100.0% | 84.6% |
| Interquartile Range (IQR) | 17.1% | 6.9% |
| Standard Deviation (Sample) | 12.1% | 8.4% |
| Standard Deviation (Population) | 12.0% | 8.3% |
Similar Demographics by In Labor Force | Age 25-29
Demographics Similar to Scotch-Irish by In Labor Force | Age 25-29
In terms of in labor force | age 25-29, the demographic groups most similar to Scotch-Irish are Arab (84.2%, a difference of 0.010%), Jordanian (84.2%, a difference of 0.010%), Immigrants from West Indies (84.2%, a difference of 0.010%), Nigerian (84.3%, a difference of 0.020%), and Korean (84.2%, a difference of 0.020%).
| Demographics | Rating | Rank | In Labor Force | Age 25-29 |
| Israelis | 9.3 /100 | #216 | Tragic 84.3% |
| Immigrants | Ecuador | 9.3 /100 | #217 | Tragic 84.3% |
| Immigrants | Nigeria | 9.0 /100 | #218 | Tragic 84.3% |
| Immigrants | Saudi Arabia | 8.8 /100 | #219 | Tragic 84.3% |
| Nigerians | 7.2 /100 | #220 | Tragic 84.3% |
| Arabs | 6.8 /100 | #221 | Tragic 84.2% |
| Jordanians | 6.7 /100 | #222 | Tragic 84.2% |
| Scotch-Irish | 6.5 /100 | #223 | Tragic 84.2% |
| Immigrants | West Indies | 6.0 /100 | #224 | Tragic 84.2% |
| Koreans | 5.9 /100 | #225 | Tragic 84.2% |
| Immigrants | Congo | 5.8 /100 | #226 | Tragic 84.2% |
| French American Indians | 5.5 /100 | #227 | Tragic 84.2% |
| Immigrants | Panama | 5.5 /100 | #228 | Tragic 84.2% |
| Immigrants | Oceania | 5.0 /100 | #229 | Tragic 84.2% |
| Whites/Caucasians | 4.8 /100 | #230 | Tragic 84.2% |
Demographics Similar to Puerto Ricans by In Labor Force | Age 25-29
In terms of in labor force | age 25-29, the demographic groups most similar to Puerto Ricans are Cheyenne (80.3%, a difference of 0.14%), Yakama (80.6%, a difference of 0.23%), Creek (80.7%, a difference of 0.34%), Ute (80.8%, a difference of 0.48%), and Choctaw (81.0%, a difference of 0.69%).
| Demographics | Rating | Rank | In Labor Force | Age 25-29 |
| Alaska Natives | 0.0 /100 | #323 | Tragic 81.6% |
| Houma | 0.0 /100 | #324 | Tragic 81.2% |
| Dutch West Indians | 0.0 /100 | #325 | Tragic 81.1% |
| Choctaw | 0.0 /100 | #326 | Tragic 81.0% |
| Ute | 0.0 /100 | #327 | Tragic 80.8% |
| Creek | 0.0 /100 | #328 | Tragic 80.7% |
| Yakama | 0.0 /100 | #329 | Tragic 80.6% |
| Puerto Ricans | 0.0 /100 | #330 | Tragic 80.4% |
| Cheyenne | 0.0 /100 | #331 | Tragic 80.3% |
| Inupiat | 0.0 /100 | #332 | Tragic 79.8% |
| Sioux | 0.0 /100 | #333 | Tragic 79.7% |
| Yuman | 0.0 /100 | #334 | Tragic 79.3% |
| Natives/Alaskans | 0.0 /100 | #335 | Tragic 79.3% |
| Apache | 0.0 /100 | #336 | Tragic 79.2% |
| Crow | 0.0 /100 | #337 | Tragic 78.6% |