Scotch-Irish vs Immigrants from Yemen In Labor Force | Age 25-29
COMPARE
Scotch-Irish
Immigrants from Yemen
In Labor Force | Age 25-29
In Labor Force | Age 25-29 Comparison
Scotch-Irish
Immigrants from Yemen
84.2%
IN LABOR FORCE | AGE 25-29
6.5/ 100
METRIC RATING
223rd/ 347
METRIC RANK
78.2%
IN LABOR FORCE | AGE 25-29
0.0/ 100
METRIC RATING
339th/ 347
METRIC RANK
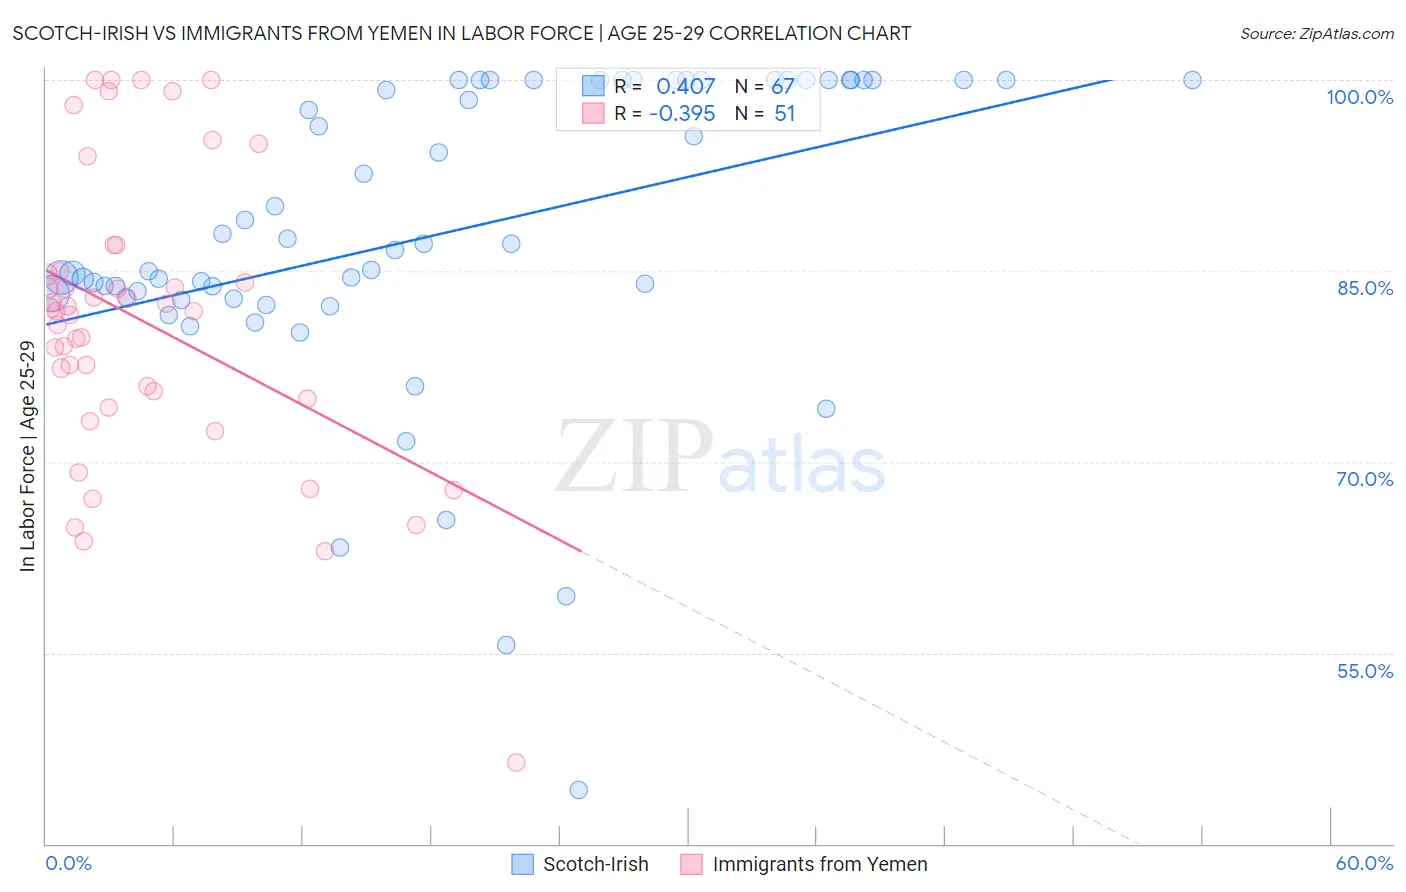
Scotch-Irish vs Immigrants from Yemen In Labor Force | Age 25-29 Correlation Chart
The statistical analysis conducted on geographies consisting of 547,797,884 people shows a moderate positive correlation between the proportion of Scotch-Irish and labor force participation rate among population between the ages 25 and 29 in the United States with a correlation coefficient (R) of 0.407 and weighted average of 84.2%. Similarly, the statistical analysis conducted on geographies consisting of 82,433,611 people shows a mild negative correlation between the proportion of Immigrants from Yemen and labor force participation rate among population between the ages 25 and 29 in the United States with a correlation coefficient (R) of -0.395 and weighted average of 78.2%, a difference of 7.7%.
In Labor Force | Age 25-29 Correlation Summary
| Measurement | Scotch-Irish | Immigrants from Yemen |
| Minimum | 44.2% | 46.4% |
| Maximum | 100.0% | 100.0% |
| Range | 55.8% | 53.6% |
| Mean | 88.0% | 81.1% |
| Median | 87.1% | 81.9% |
| Interquartile 25% (IQ1) | 82.9% | 75.0% |
| Interquartile 75% (IQ3) | 100.0% | 85.0% |
| Interquartile Range (IQR) | 17.1% | 10.0% |
| Standard Deviation (Sample) | 12.1% | 11.4% |
| Standard Deviation (Population) | 12.0% | 11.2% |
Similar Demographics by In Labor Force | Age 25-29
Demographics Similar to Scotch-Irish by In Labor Force | Age 25-29
In terms of in labor force | age 25-29, the demographic groups most similar to Scotch-Irish are Arab (84.2%, a difference of 0.010%), Jordanian (84.2%, a difference of 0.010%), Immigrants from West Indies (84.2%, a difference of 0.010%), Nigerian (84.3%, a difference of 0.020%), and Korean (84.2%, a difference of 0.020%).
| Demographics | Rating | Rank | In Labor Force | Age 25-29 |
| Israelis | 9.3 /100 | #216 | Tragic 84.3% |
| Immigrants | Ecuador | 9.3 /100 | #217 | Tragic 84.3% |
| Immigrants | Nigeria | 9.0 /100 | #218 | Tragic 84.3% |
| Immigrants | Saudi Arabia | 8.8 /100 | #219 | Tragic 84.3% |
| Nigerians | 7.2 /100 | #220 | Tragic 84.3% |
| Arabs | 6.8 /100 | #221 | Tragic 84.2% |
| Jordanians | 6.7 /100 | #222 | Tragic 84.2% |
| Scotch-Irish | 6.5 /100 | #223 | Tragic 84.2% |
| Immigrants | West Indies | 6.0 /100 | #224 | Tragic 84.2% |
| Koreans | 5.9 /100 | #225 | Tragic 84.2% |
| Immigrants | Congo | 5.8 /100 | #226 | Tragic 84.2% |
| French American Indians | 5.5 /100 | #227 | Tragic 84.2% |
| Immigrants | Panama | 5.5 /100 | #228 | Tragic 84.2% |
| Immigrants | Oceania | 5.0 /100 | #229 | Tragic 84.2% |
| Whites/Caucasians | 4.8 /100 | #230 | Tragic 84.2% |
Demographics Similar to Immigrants from Yemen by In Labor Force | Age 25-29
In terms of in labor force | age 25-29, the demographic groups most similar to Immigrants from Yemen are Lumbee (78.3%, a difference of 0.12%), Paiute (78.1%, a difference of 0.16%), Crow (78.6%, a difference of 0.49%), Tohono O'odham (77.5%, a difference of 0.94%), and Pueblo (77.5%, a difference of 0.96%).
| Demographics | Rating | Rank | In Labor Force | Age 25-29 |
| Inupiat | 0.0 /100 | #332 | Tragic 79.8% |
| Sioux | 0.0 /100 | #333 | Tragic 79.7% |
| Yuman | 0.0 /100 | #334 | Tragic 79.3% |
| Natives/Alaskans | 0.0 /100 | #335 | Tragic 79.3% |
| Apache | 0.0 /100 | #336 | Tragic 79.2% |
| Crow | 0.0 /100 | #337 | Tragic 78.6% |
| Lumbee | 0.0 /100 | #338 | Tragic 78.3% |
| Immigrants | Yemen | 0.0 /100 | #339 | Tragic 78.2% |
| Paiute | 0.0 /100 | #340 | Tragic 78.1% |
| Tohono O'odham | 0.0 /100 | #341 | Tragic 77.5% |
| Pueblo | 0.0 /100 | #342 | Tragic 77.5% |
| Arapaho | 0.0 /100 | #343 | Tragic 76.6% |
| Hopi | 0.0 /100 | #344 | Tragic 76.5% |
| Navajo | 0.0 /100 | #345 | Tragic 74.6% |
| Pima | 0.0 /100 | #346 | Tragic 74.3% |