Indonesian vs Afghan In Labor Force | Age 25-29
COMPARE
Indonesian
Afghan
In Labor Force | Age 25-29
In Labor Force | Age 25-29 Comparison
Indonesians
Afghans
84.7%
IN LABOR FORCE | AGE 25-29
56.5/ 100
METRIC RATING
167th/ 347
METRIC RANK
84.4%
IN LABOR FORCE | AGE 25-29
15.9/ 100
METRIC RATING
202nd/ 347
METRIC RANK
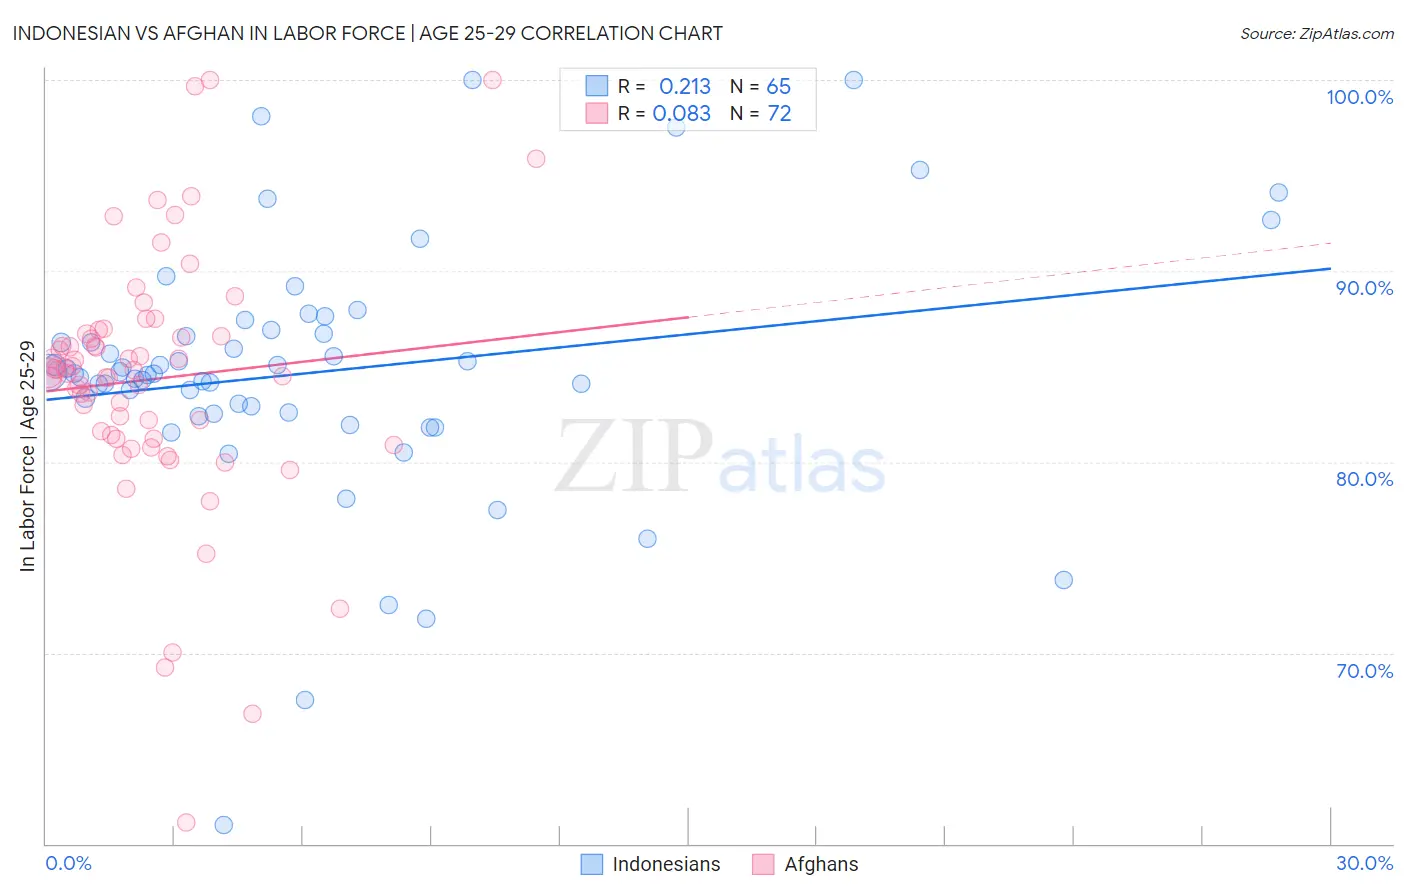
Indonesian vs Afghan In Labor Force | Age 25-29 Correlation Chart
The statistical analysis conducted on geographies consisting of 162,720,182 people shows a weak positive correlation between the proportion of Indonesians and labor force participation rate among population between the ages 25 and 29 in the United States with a correlation coefficient (R) of 0.213 and weighted average of 84.7%. Similarly, the statistical analysis conducted on geographies consisting of 148,868,617 people shows a slight positive correlation between the proportion of Afghans and labor force participation rate among population between the ages 25 and 29 in the United States with a correlation coefficient (R) of 0.083 and weighted average of 84.4%, a difference of 0.36%.
In Labor Force | Age 25-29 Correlation Summary
| Measurement | Indonesian | Afghan |
| Minimum | 61.0% | 61.1% |
| Maximum | 100.0% | 100.0% |
| Range | 39.0% | 38.9% |
| Mean | 84.7% | 84.3% |
| Median | 84.6% | 84.7% |
| Interquartile 25% (IQ1) | 82.6% | 81.3% |
| Interquartile 75% (IQ3) | 86.8% | 86.7% |
| Interquartile Range (IQR) | 4.2% | 5.4% |
| Standard Deviation (Sample) | 6.7% | 6.7% |
| Standard Deviation (Population) | 6.6% | 6.6% |
Similar Demographics by In Labor Force | Age 25-29
Demographics Similar to Indonesians by In Labor Force | Age 25-29
In terms of in labor force | age 25-29, the demographic groups most similar to Indonesians are Immigrants from Spain (84.7%, a difference of 0.0%), Immigrants from Colombia (84.7%, a difference of 0.010%), Argentinean (84.7%, a difference of 0.010%), Ghanaian (84.7%, a difference of 0.010%), and Immigrants from Burma/Myanmar (84.7%, a difference of 0.010%).
| Demographics | Rating | Rank | In Labor Force | Age 25-29 |
| Immigrants | Peru | 58.6 /100 | #160 | Average 84.7% |
| Canadians | 58.5 /100 | #161 | Average 84.7% |
| Immigrants | Colombia | 58.3 /100 | #162 | Average 84.7% |
| Argentineans | 57.9 /100 | #163 | Average 84.7% |
| Ghanaians | 57.6 /100 | #164 | Average 84.7% |
| Immigrants | Burma/Myanmar | 57.4 /100 | #165 | Average 84.7% |
| Immigrants | Spain | 56.9 /100 | #166 | Average 84.7% |
| Indonesians | 56.5 /100 | #167 | Average 84.7% |
| South Americans | 54.9 /100 | #168 | Average 84.7% |
| Celtics | 52.5 /100 | #169 | Average 84.7% |
| Tongans | 52.4 /100 | #170 | Average 84.7% |
| Immigrants | Vietnam | 50.5 /100 | #171 | Average 84.7% |
| Immigrants | Western Europe | 50.4 /100 | #172 | Average 84.7% |
| Assyrians/Chaldeans/Syriacs | 50.2 /100 | #173 | Average 84.7% |
| Palestinians | 50.0 /100 | #174 | Average 84.7% |
Demographics Similar to Afghans by In Labor Force | Age 25-29
In terms of in labor force | age 25-29, the demographic groups most similar to Afghans are Immigrants from Afghanistan (84.4%, a difference of 0.0%), Laotian (84.4%, a difference of 0.010%), Venezuelan (84.4%, a difference of 0.010%), Immigrants from Kazakhstan (84.4%, a difference of 0.020%), and Ecuadorian (84.4%, a difference of 0.020%).
| Demographics | Rating | Rank | In Labor Force | Age 25-29 |
| Immigrants | Israel | 20.8 /100 | #195 | Fair 84.4% |
| Immigrants | South Eastern Asia | 19.5 /100 | #196 | Poor 84.4% |
| Tlingit-Haida | 19.3 /100 | #197 | Poor 84.4% |
| Immigrants | Iraq | 19.0 /100 | #198 | Poor 84.4% |
| Immigrants | Germany | 18.3 /100 | #199 | Poor 84.4% |
| Immigrants | Kazakhstan | 17.5 /100 | #200 | Poor 84.4% |
| Laotians | 16.6 /100 | #201 | Poor 84.4% |
| Afghans | 15.9 /100 | #202 | Poor 84.4% |
| Immigrants | Afghanistan | 15.6 /100 | #203 | Poor 84.4% |
| Venezuelans | 15.1 /100 | #204 | Poor 84.4% |
| Ecuadorians | 14.8 /100 | #205 | Poor 84.4% |
| Immigrants | Cambodia | 14.3 /100 | #206 | Poor 84.4% |
| Immigrants | Armenia | 13.3 /100 | #207 | Poor 84.4% |
| Immigrants | Indonesia | 13.2 /100 | #208 | Poor 84.4% |
| Immigrants | Jordan | 12.8 /100 | #209 | Poor 84.4% |