Peruvian vs Menominee In Labor Force | Age > 16
COMPARE
Peruvian
Menominee
In Labor Force | Age > 16
In Labor Force | Age > 16 Comparison
Peruvians
Menominee
66.3%
IN LABOR FORCE | AGE > 16
99.8/ 100
METRIC RATING
64th/ 347
METRIC RANK
60.6%
IN LABOR FORCE | AGE > 16
0.0/ 100
METRIC RATING
336th/ 347
METRIC RANK
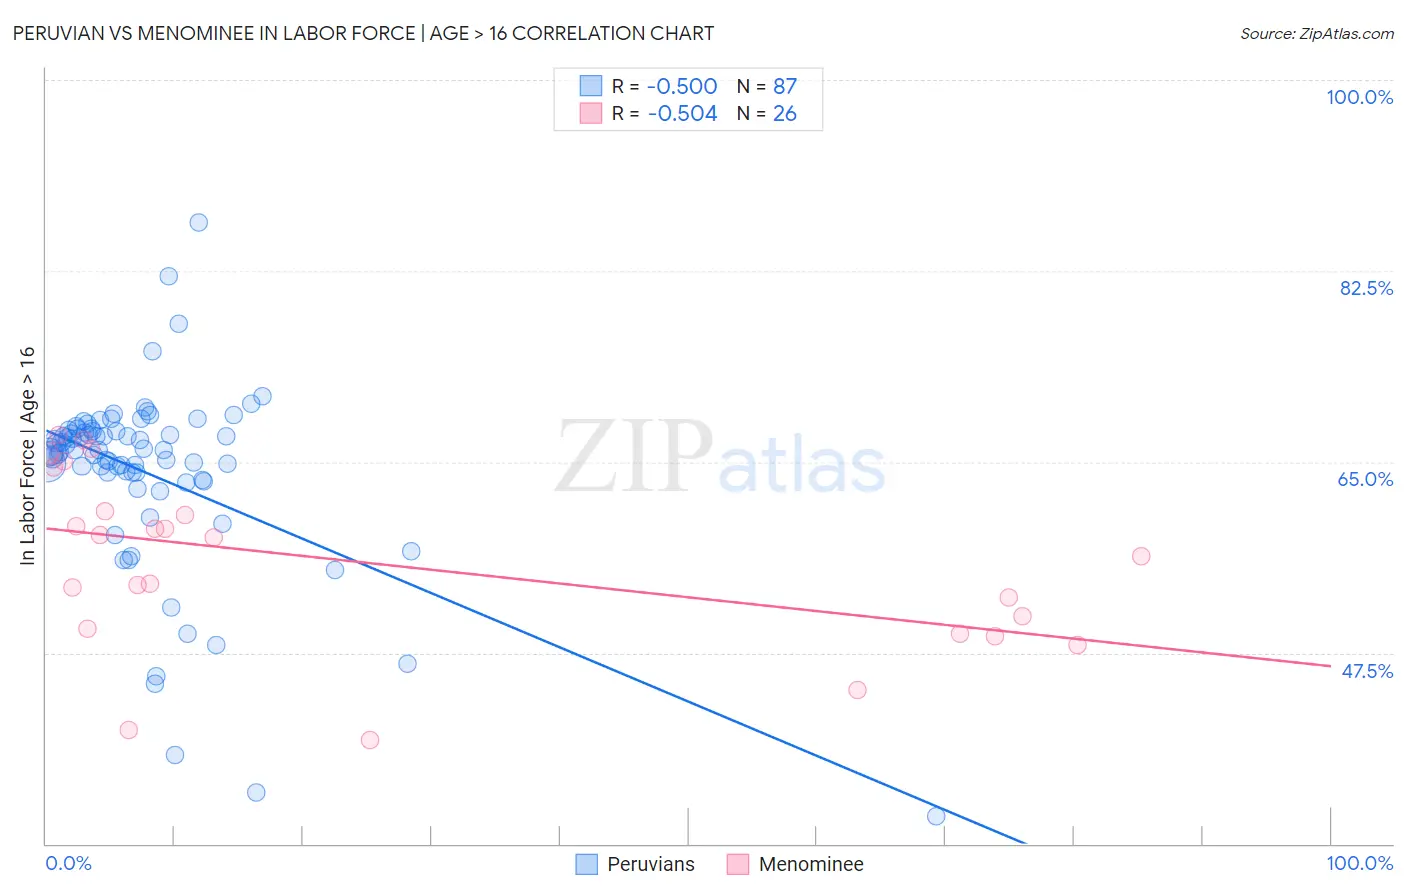
Peruvian vs Menominee In Labor Force | Age > 16 Correlation Chart
The statistical analysis conducted on geographies consisting of 363,253,331 people shows a moderate negative correlation between the proportion of Peruvians and labor force participation rate among population ages 16 and over in the United States with a correlation coefficient (R) of -0.500 and weighted average of 66.3%. Similarly, the statistical analysis conducted on geographies consisting of 45,777,849 people shows a substantial negative correlation between the proportion of Menominee and labor force participation rate among population ages 16 and over in the United States with a correlation coefficient (R) of -0.504 and weighted average of 60.6%, a difference of 9.4%.
In Labor Force | Age > 16 Correlation Summary
| Measurement | Peruvian | Menominee |
| Minimum | 32.5% | 39.5% |
| Maximum | 86.9% | 67.4% |
| Range | 54.4% | 27.9% |
| Mean | 64.0% | 55.8% |
| Median | 66.1% | 57.2% |
| Interquartile 25% (IQ1) | 63.4% | 49.8% |
| Interquartile 75% (IQ3) | 67.8% | 60.5% |
| Interquartile Range (IQR) | 4.4% | 10.7% |
| Standard Deviation (Sample) | 8.6% | 8.0% |
| Standard Deviation (Population) | 8.6% | 7.8% |
Similar Demographics by In Labor Force | Age > 16
Demographics Similar to Peruvians by In Labor Force | Age > 16
In terms of in labor force | age > 16, the demographic groups most similar to Peruvians are Venezuelan (66.3%, a difference of 0.0%), Sri Lankan (66.3%, a difference of 0.010%), Jordanian (66.3%, a difference of 0.030%), Immigrants from Peru (66.3%, a difference of 0.040%), and Immigrants from Burma/Myanmar (66.3%, a difference of 0.040%).
| Demographics | Rating | Rank | In Labor Force | Age > 16 |
| Bulgarians | 99.9 /100 | #57 | Exceptional 66.4% |
| Immigrants | Saudi Arabia | 99.9 /100 | #58 | Exceptional 66.3% |
| Immigrants | Turkey | 99.9 /100 | #59 | Exceptional 66.3% |
| Immigrants | Peru | 99.8 /100 | #60 | Exceptional 66.3% |
| Immigrants | Burma/Myanmar | 99.8 /100 | #61 | Exceptional 66.3% |
| Indonesians | 99.8 /100 | #62 | Exceptional 66.3% |
| Venezuelans | 99.8 /100 | #63 | Exceptional 66.3% |
| Peruvians | 99.8 /100 | #64 | Exceptional 66.3% |
| Sri Lankans | 99.8 /100 | #65 | Exceptional 66.3% |
| Jordanians | 99.8 /100 | #66 | Exceptional 66.3% |
| Egyptians | 99.8 /100 | #67 | Exceptional 66.2% |
| Immigrants | Egypt | 99.7 /100 | #68 | Exceptional 66.2% |
| Sub-Saharan Africans | 99.7 /100 | #69 | Exceptional 66.2% |
| Asians | 99.7 /100 | #70 | Exceptional 66.2% |
| Burmese | 99.7 /100 | #71 | Exceptional 66.2% |
Demographics Similar to Menominee by In Labor Force | Age > 16
In terms of in labor force | age > 16, the demographic groups most similar to Menominee are Native/Alaskan (60.6%, a difference of 0.020%), Apache (60.7%, a difference of 0.21%), Paiute (60.7%, a difference of 0.26%), Crow (60.8%, a difference of 0.34%), and Ute (60.9%, a difference of 0.51%).
| Demographics | Rating | Rank | In Labor Force | Age > 16 |
| Choctaw | 0.0 /100 | #329 | Tragic 61.5% |
| Creek | 0.0 /100 | #330 | Tragic 61.3% |
| Ute | 0.0 /100 | #331 | Tragic 60.9% |
| Crow | 0.0 /100 | #332 | Tragic 60.8% |
| Paiute | 0.0 /100 | #333 | Tragic 60.7% |
| Apache | 0.0 /100 | #334 | Tragic 60.7% |
| Natives/Alaskans | 0.0 /100 | #335 | Tragic 60.6% |
| Menominee | 0.0 /100 | #336 | Tragic 60.6% |
| Colville | 0.0 /100 | #337 | Tragic 59.8% |
| Immigrants | Yemen | 0.0 /100 | #338 | Tragic 59.6% |
| Houma | 0.0 /100 | #339 | Tragic 59.5% |
| Pueblo | 0.0 /100 | #340 | Tragic 59.3% |
| Hopi | 0.0 /100 | #341 | Tragic 58.4% |
| Puerto Ricans | 0.0 /100 | #342 | Tragic 58.1% |
| Yuman | 0.0 /100 | #343 | Tragic 57.8% |