Menominee vs Immigrants from Afghanistan In Labor Force | Age 35-44
COMPARE
Menominee
Immigrants from Afghanistan
In Labor Force | Age 35-44
In Labor Force | Age 35-44 Comparison
Menominee
Immigrants from Afghanistan
79.7%
IN LABOR FORCE | AGE 35-44
0.0/ 100
METRIC RATING
329th/ 347
METRIC RANK
84.4%
IN LABOR FORCE | AGE 35-44
52.7/ 100
METRIC RATING
169th/ 347
METRIC RANK
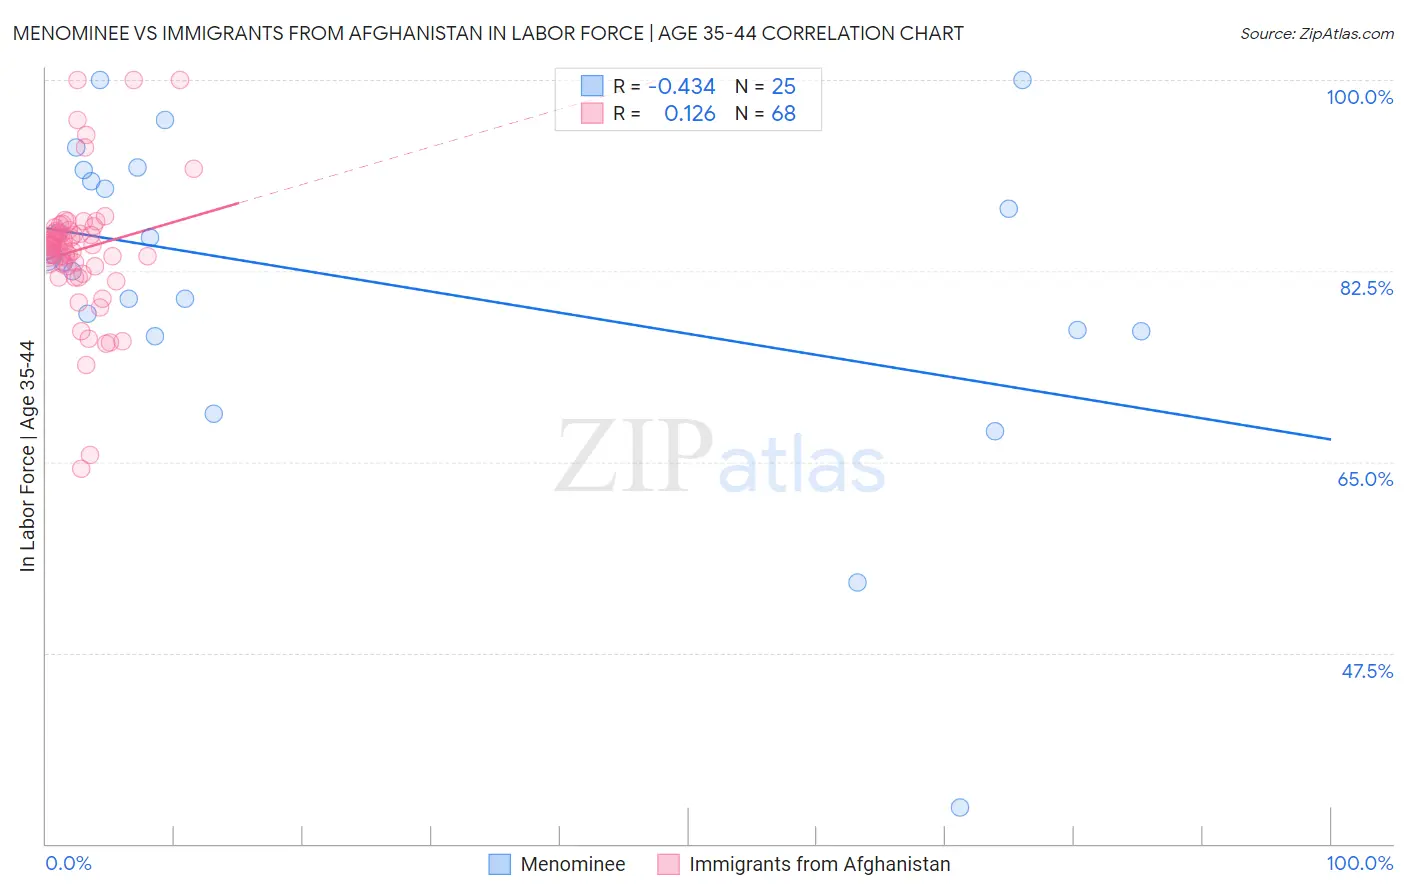
Menominee vs Immigrants from Afghanistan In Labor Force | Age 35-44 Correlation Chart
The statistical analysis conducted on geographies consisting of 45,777,730 people shows a moderate negative correlation between the proportion of Menominee and labor force participation rate among population between the ages 35 and 44 in the United States with a correlation coefficient (R) of -0.434 and weighted average of 79.7%. Similarly, the statistical analysis conducted on geographies consisting of 147,638,849 people shows a poor positive correlation between the proportion of Immigrants from Afghanistan and labor force participation rate among population between the ages 35 and 44 in the United States with a correlation coefficient (R) of 0.126 and weighted average of 84.4%, a difference of 5.9%.
In Labor Force | Age 35-44 Correlation Summary
| Measurement | Menominee | Immigrants from Afghanistan |
| Minimum | 33.3% | 64.4% |
| Maximum | 100.0% | 100.0% |
| Range | 66.7% | 35.6% |
| Mean | 81.7% | 84.4% |
| Median | 83.9% | 84.8% |
| Interquartile 25% (IQ1) | 77.0% | 82.9% |
| Interquartile 75% (IQ3) | 91.2% | 86.2% |
| Interquartile Range (IQR) | 14.2% | 3.3% |
| Standard Deviation (Sample) | 14.5% | 6.1% |
| Standard Deviation (Population) | 14.2% | 6.1% |
Similar Demographics by In Labor Force | Age 35-44
Demographics Similar to Menominee by In Labor Force | Age 35-44
In terms of in labor force | age 35-44, the demographic groups most similar to Menominee are Cheyenne (79.5%, a difference of 0.20%), Houma (79.5%, a difference of 0.22%), Ute (79.4%, a difference of 0.28%), Creek (80.0%, a difference of 0.44%), and Kiowa (79.2%, a difference of 0.61%).
| Demographics | Rating | Rank | In Labor Force | Age 35-44 |
| Paiute | 0.0 /100 | #322 | Tragic 80.6% |
| Yaqui | 0.0 /100 | #323 | Tragic 80.5% |
| Choctaw | 0.0 /100 | #324 | Tragic 80.5% |
| Dutch West Indians | 0.0 /100 | #325 | Tragic 80.4% |
| Seminole | 0.0 /100 | #326 | Tragic 80.4% |
| Sioux | 0.0 /100 | #327 | Tragic 80.2% |
| Creek | 0.0 /100 | #328 | Tragic 80.0% |
| Menominee | 0.0 /100 | #329 | Tragic 79.7% |
| Cheyenne | 0.0 /100 | #330 | Tragic 79.5% |
| Houma | 0.0 /100 | #331 | Tragic 79.5% |
| Ute | 0.0 /100 | #332 | Tragic 79.4% |
| Kiowa | 0.0 /100 | #333 | Tragic 79.2% |
| Yakama | 0.0 /100 | #334 | Tragic 79.0% |
| Natives/Alaskans | 0.0 /100 | #335 | Tragic 78.9% |
| Arapaho | 0.0 /100 | #336 | Tragic 78.1% |
Demographics Similar to Immigrants from Afghanistan by In Labor Force | Age 35-44
In terms of in labor force | age 35-44, the demographic groups most similar to Immigrants from Afghanistan are Irish (84.4%, a difference of 0.0%), Immigrants from Jordan (84.4%, a difference of 0.0%), Jordanian (84.4%, a difference of 0.010%), Scandinavian (84.4%, a difference of 0.010%), and Immigrants from Trinidad and Tobago (84.4%, a difference of 0.010%).
| Demographics | Rating | Rank | In Labor Force | Age 35-44 |
| Immigrants | Hungary | 59.4 /100 | #162 | Average 84.4% |
| Aleuts | 59.1 /100 | #163 | Average 84.4% |
| Nigerians | 58.9 /100 | #164 | Average 84.4% |
| Venezuelans | 58.1 /100 | #165 | Average 84.4% |
| Alsatians | 55.2 /100 | #166 | Average 84.4% |
| Immigrants | Portugal | 55.2 /100 | #167 | Average 84.4% |
| Irish | 53.1 /100 | #168 | Average 84.4% |
| Immigrants | Afghanistan | 52.7 /100 | #169 | Average 84.4% |
| Immigrants | Jordan | 52.5 /100 | #170 | Average 84.4% |
| Jordanians | 51.7 /100 | #171 | Average 84.4% |
| Scandinavians | 51.2 /100 | #172 | Average 84.4% |
| Immigrants | Trinidad and Tobago | 50.7 /100 | #173 | Average 84.4% |
| Immigrants | Iran | 50.0 /100 | #174 | Average 84.4% |
| Pakistanis | 48.2 /100 | #175 | Average 84.4% |
| Sri Lankans | 47.3 /100 | #176 | Average 84.4% |