Menominee vs Bulgarian In Labor Force | Age 35-44
COMPARE
Menominee
Bulgarian
In Labor Force | Age 35-44
In Labor Force | Age 35-44 Comparison
Menominee
Bulgarians
79.7%
IN LABOR FORCE | AGE 35-44
0.0/ 100
METRIC RATING
329th/ 347
METRIC RANK
85.5%
IN LABOR FORCE | AGE 35-44
100.0/ 100
METRIC RATING
21st/ 347
METRIC RANK
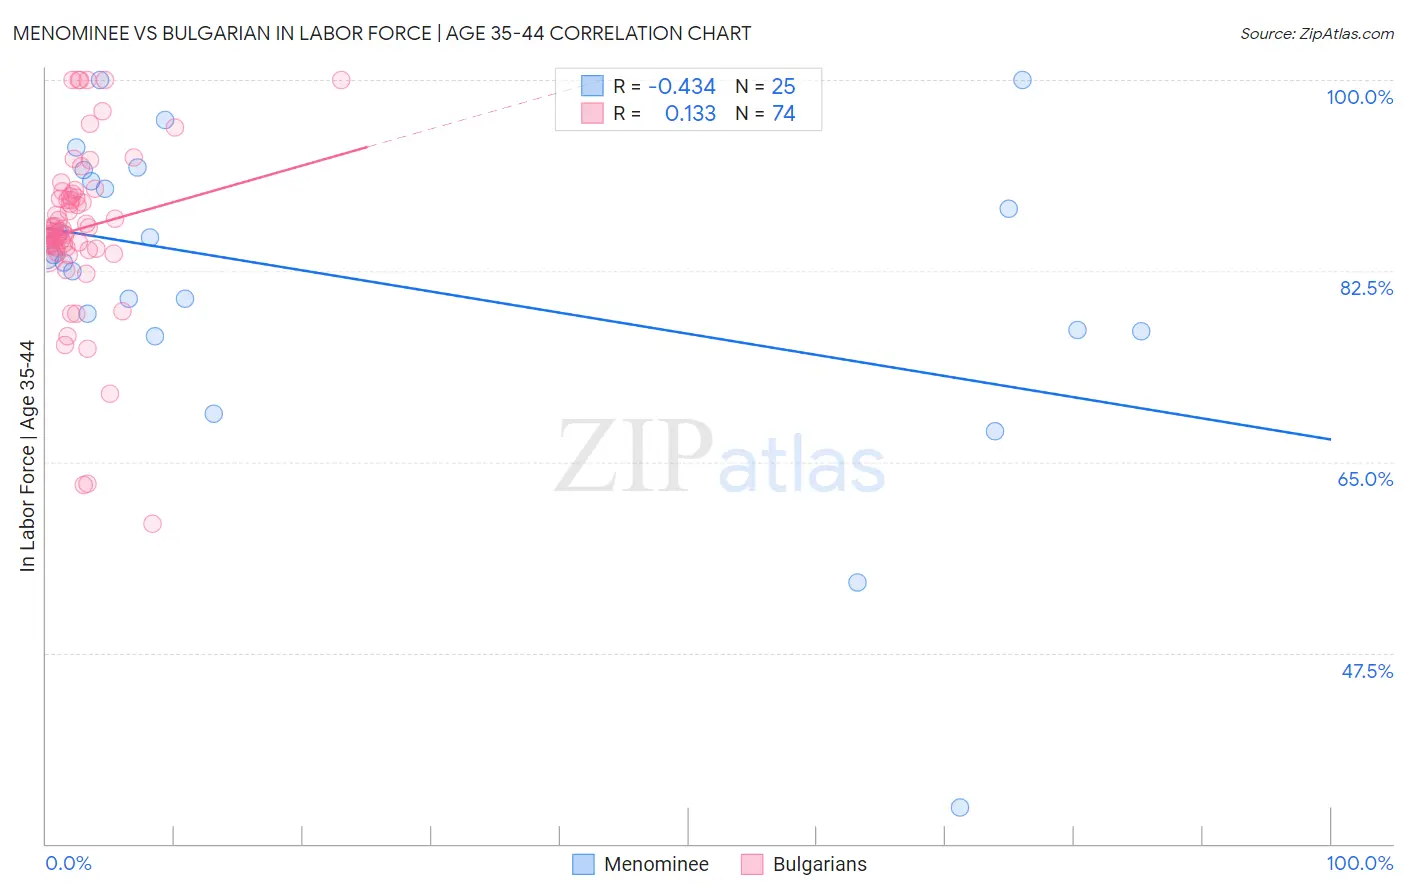
Menominee vs Bulgarian In Labor Force | Age 35-44 Correlation Chart
The statistical analysis conducted on geographies consisting of 45,777,730 people shows a moderate negative correlation between the proportion of Menominee and labor force participation rate among population between the ages 35 and 44 in the United States with a correlation coefficient (R) of -0.434 and weighted average of 79.7%. Similarly, the statistical analysis conducted on geographies consisting of 205,570,158 people shows a poor positive correlation between the proportion of Bulgarians and labor force participation rate among population between the ages 35 and 44 in the United States with a correlation coefficient (R) of 0.133 and weighted average of 85.5%, a difference of 7.3%.
In Labor Force | Age 35-44 Correlation Summary
| Measurement | Menominee | Bulgarian |
| Minimum | 33.3% | 59.3% |
| Maximum | 100.0% | 100.0% |
| Range | 66.7% | 40.7% |
| Mean | 81.7% | 86.3% |
| Median | 83.9% | 86.0% |
| Interquartile 25% (IQ1) | 77.0% | 84.7% |
| Interquartile 75% (IQ3) | 91.2% | 89.4% |
| Interquartile Range (IQR) | 14.2% | 4.7% |
| Standard Deviation (Sample) | 14.5% | 7.7% |
| Standard Deviation (Population) | 14.2% | 7.7% |
Similar Demographics by In Labor Force | Age 35-44
Demographics Similar to Menominee by In Labor Force | Age 35-44
In terms of in labor force | age 35-44, the demographic groups most similar to Menominee are Cheyenne (79.5%, a difference of 0.20%), Houma (79.5%, a difference of 0.22%), Ute (79.4%, a difference of 0.28%), Creek (80.0%, a difference of 0.44%), and Kiowa (79.2%, a difference of 0.61%).
| Demographics | Rating | Rank | In Labor Force | Age 35-44 |
| Paiute | 0.0 /100 | #322 | Tragic 80.6% |
| Yaqui | 0.0 /100 | #323 | Tragic 80.5% |
| Choctaw | 0.0 /100 | #324 | Tragic 80.5% |
| Dutch West Indians | 0.0 /100 | #325 | Tragic 80.4% |
| Seminole | 0.0 /100 | #326 | Tragic 80.4% |
| Sioux | 0.0 /100 | #327 | Tragic 80.2% |
| Creek | 0.0 /100 | #328 | Tragic 80.0% |
| Menominee | 0.0 /100 | #329 | Tragic 79.7% |
| Cheyenne | 0.0 /100 | #330 | Tragic 79.5% |
| Houma | 0.0 /100 | #331 | Tragic 79.5% |
| Ute | 0.0 /100 | #332 | Tragic 79.4% |
| Kiowa | 0.0 /100 | #333 | Tragic 79.2% |
| Yakama | 0.0 /100 | #334 | Tragic 79.0% |
| Natives/Alaskans | 0.0 /100 | #335 | Tragic 78.9% |
| Arapaho | 0.0 /100 | #336 | Tragic 78.1% |
Demographics Similar to Bulgarians by In Labor Force | Age 35-44
In terms of in labor force | age 35-44, the demographic groups most similar to Bulgarians are Immigrants from Bosnia and Herzegovina (85.4%, a difference of 0.040%), Immigrants from Serbia (85.5%, a difference of 0.060%), Immigrants from Eastern Africa (85.4%, a difference of 0.060%), Carpatho Rusyn (85.6%, a difference of 0.10%), and Slovene (85.6%, a difference of 0.10%).
| Demographics | Rating | Rank | In Labor Force | Age 35-44 |
| Immigrants | Somalia | 100.0 /100 | #14 | Exceptional 85.6% |
| Norwegians | 100.0 /100 | #15 | Exceptional 85.6% |
| Immigrants | Ireland | 100.0 /100 | #16 | Exceptional 85.6% |
| Immigrants | North Macedonia | 100.0 /100 | #17 | Exceptional 85.6% |
| Carpatho Rusyns | 100.0 /100 | #18 | Exceptional 85.6% |
| Slovenes | 100.0 /100 | #19 | Exceptional 85.6% |
| Immigrants | Serbia | 100.0 /100 | #20 | Exceptional 85.5% |
| Bulgarians | 100.0 /100 | #21 | Exceptional 85.5% |
| Immigrants | Bosnia and Herzegovina | 100.0 /100 | #22 | Exceptional 85.4% |
| Immigrants | Eastern Africa | 100.0 /100 | #23 | Exceptional 85.4% |
| Latvians | 99.9 /100 | #24 | Exceptional 85.4% |
| Paraguayans | 99.9 /100 | #25 | Exceptional 85.4% |
| Immigrants | Liberia | 99.9 /100 | #26 | Exceptional 85.4% |
| Immigrants | Lithuania | 99.9 /100 | #27 | Exceptional 85.4% |
| Immigrants | Greece | 99.9 /100 | #28 | Exceptional 85.3% |