Menominee vs Immigrants from Afghanistan Disability Age 5 to 17
COMPARE
Menominee
Immigrants from Afghanistan
Disability Age 5 to 17
Disability Age 5 to 17 Comparison
Menominee
Immigrants from Afghanistan
5.3%
DISABILITY AGE 5 TO 17
98.7/ 100
METRIC RATING
101st/ 347
METRIC RANK
5.3%
DISABILITY AGE 5 TO 17
97.4/ 100
METRIC RATING
117th/ 347
METRIC RANK
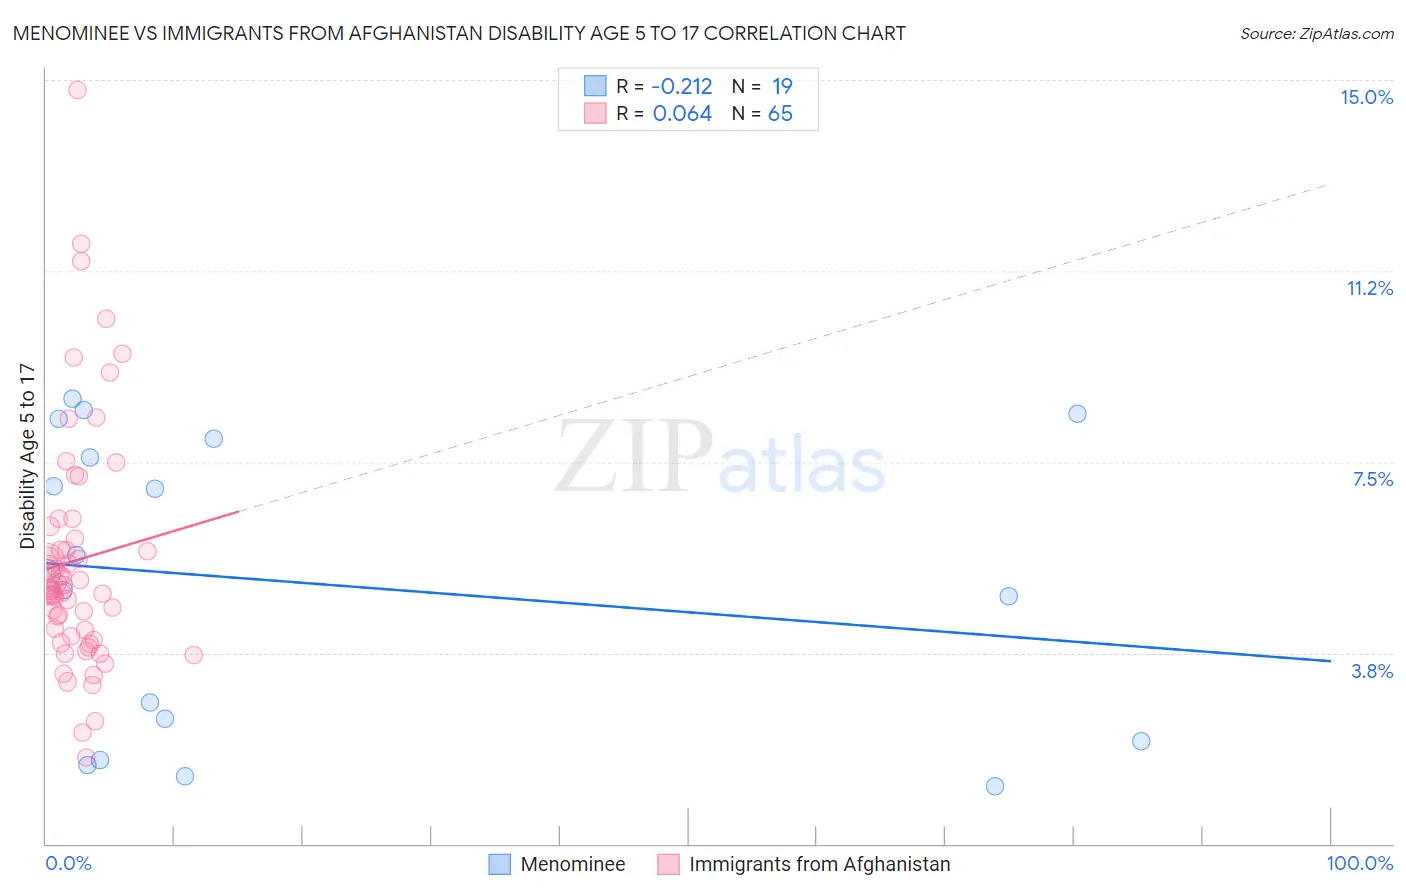
Menominee vs Immigrants from Afghanistan Disability Age 5 to 17 Correlation Chart
The statistical analysis conducted on geographies consisting of 45,659,634 people shows a weak negative correlation between the proportion of Menominee and percentage of population with a disability between the ages 5 and 17 in the United States with a correlation coefficient (R) of -0.212 and weighted average of 5.3%. Similarly, the statistical analysis conducted on geographies consisting of 147,197,309 people shows a slight positive correlation between the proportion of Immigrants from Afghanistan and percentage of population with a disability between the ages 5 and 17 in the United States with a correlation coefficient (R) of 0.064 and weighted average of 5.3%, a difference of 0.92%.
Disability Age 5 to 17 Correlation Summary
| Measurement | Menominee | Immigrants from Afghanistan |
| Minimum | 1.1% | 1.7% |
| Maximum | 8.7% | 14.8% |
| Range | 7.6% | 13.1% |
| Mean | 5.1% | 5.6% |
| Median | 5.3% | 5.0% |
| Interquartile 25% (IQ1) | 2.0% | 4.0% |
| Interquartile 75% (IQ3) | 8.0% | 6.1% |
| Interquartile Range (IQR) | 5.9% | 2.1% |
| Standard Deviation (Sample) | 2.8% | 2.4% |
| Standard Deviation (Population) | 2.8% | 2.4% |
Demographics Similar to Menominee and Immigrants from Afghanistan by Disability Age 5 to 17
In terms of disability age 5 to 17, the demographic groups most similar to Menominee are Nepalese (5.3%, a difference of 0.020%), Nicaraguan (5.3%, a difference of 0.080%), Salvadoran (5.3%, a difference of 0.11%), Cambodian (5.3%, a difference of 0.18%), and Peruvian (5.3%, a difference of 0.18%). Similarly, the demographic groups most similar to Immigrants from Afghanistan are South American (5.4%, a difference of 0.11%), Immigrants from South America (5.4%, a difference of 0.11%), Cypriot (5.3%, a difference of 0.16%), Cuban (5.3%, a difference of 0.23%), and Immigrants from Northern Europe (5.3%, a difference of 0.24%).
| Demographics | Rating | Rank | Disability Age 5 to 17 |
| Cambodians | 98.8 /100 | #99 | Exceptional 5.3% |
| Nepalese | 98.7 /100 | #100 | Exceptional 5.3% |
| Menominee | 98.7 /100 | #101 | Exceptional 5.3% |
| Nicaraguans | 98.6 /100 | #102 | Exceptional 5.3% |
| Salvadorans | 98.6 /100 | #103 | Exceptional 5.3% |
| Peruvians | 98.5 /100 | #104 | Exceptional 5.3% |
| Immigrants | Italy | 98.4 /100 | #105 | Exceptional 5.3% |
| Immigrants | Yemen | 98.2 /100 | #106 | Exceptional 5.3% |
| Russians | 98.2 /100 | #107 | Exceptional 5.3% |
| Immigrants | South Africa | 98.1 /100 | #108 | Exceptional 5.3% |
| Immigrants | Northern Africa | 98.1 /100 | #109 | Exceptional 5.3% |
| Immigrants | Eritrea | 98.0 /100 | #110 | Exceptional 5.3% |
| Ethiopians | 97.9 /100 | #111 | Exceptional 5.3% |
| Immigrants | Latvia | 97.9 /100 | #112 | Exceptional 5.3% |
| Aleuts | 97.8 /100 | #113 | Exceptional 5.3% |
| Immigrants | Northern Europe | 97.8 /100 | #114 | Exceptional 5.3% |
| Cubans | 97.8 /100 | #115 | Exceptional 5.3% |
| Cypriots | 97.7 /100 | #116 | Exceptional 5.3% |
| Immigrants | Afghanistan | 97.4 /100 | #117 | Exceptional 5.3% |
| South Americans | 97.1 /100 | #118 | Exceptional 5.4% |
| Immigrants | South America | 97.1 /100 | #119 | Exceptional 5.4% |