Menominee vs Immigrants from St. Vincent and the Grenadines In Labor Force | Age 35-44
COMPARE
Menominee
Immigrants from St. Vincent and the Grenadines
In Labor Force | Age 35-44
In Labor Force | Age 35-44 Comparison
Menominee
Immigrants from St. Vincent and the Grenadines
79.7%
IN LABOR FORCE | AGE 35-44
0.0/ 100
METRIC RATING
329th/ 347
METRIC RANK
83.7%
IN LABOR FORCE | AGE 35-44
0.7/ 100
METRIC RATING
249th/ 347
METRIC RANK
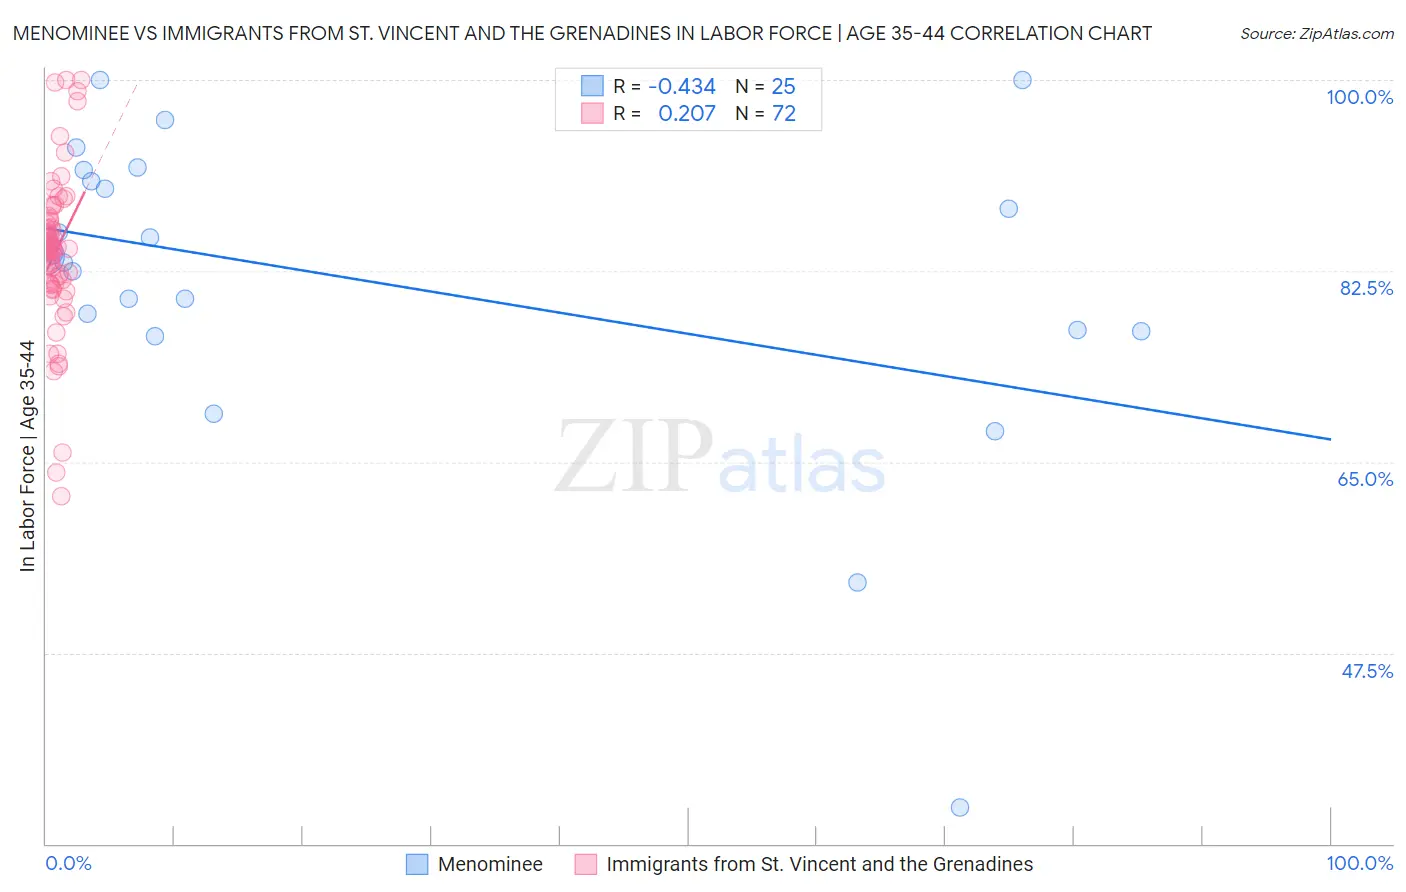
Menominee vs Immigrants from St. Vincent and the Grenadines In Labor Force | Age 35-44 Correlation Chart
The statistical analysis conducted on geographies consisting of 45,777,730 people shows a moderate negative correlation between the proportion of Menominee and labor force participation rate among population between the ages 35 and 44 in the United States with a correlation coefficient (R) of -0.434 and weighted average of 79.7%. Similarly, the statistical analysis conducted on geographies consisting of 56,188,322 people shows a weak positive correlation between the proportion of Immigrants from St. Vincent and the Grenadines and labor force participation rate among population between the ages 35 and 44 in the United States with a correlation coefficient (R) of 0.207 and weighted average of 83.7%, a difference of 5.1%.
In Labor Force | Age 35-44 Correlation Summary
| Measurement | Menominee | Immigrants from St. Vincent and the Grenadines |
| Minimum | 33.3% | 61.9% |
| Maximum | 100.0% | 100.0% |
| Range | 66.7% | 38.1% |
| Mean | 81.7% | 84.2% |
| Median | 83.9% | 84.5% |
| Interquartile 25% (IQ1) | 77.0% | 81.3% |
| Interquartile 75% (IQ3) | 91.2% | 87.2% |
| Interquartile Range (IQR) | 14.2% | 5.9% |
| Standard Deviation (Sample) | 14.5% | 7.2% |
| Standard Deviation (Population) | 14.2% | 7.1% |
Similar Demographics by In Labor Force | Age 35-44
Demographics Similar to Menominee by In Labor Force | Age 35-44
In terms of in labor force | age 35-44, the demographic groups most similar to Menominee are Cheyenne (79.5%, a difference of 0.20%), Houma (79.5%, a difference of 0.22%), Ute (79.4%, a difference of 0.28%), Creek (80.0%, a difference of 0.44%), and Kiowa (79.2%, a difference of 0.61%).
| Demographics | Rating | Rank | In Labor Force | Age 35-44 |
| Paiute | 0.0 /100 | #322 | Tragic 80.6% |
| Yaqui | 0.0 /100 | #323 | Tragic 80.5% |
| Choctaw | 0.0 /100 | #324 | Tragic 80.5% |
| Dutch West Indians | 0.0 /100 | #325 | Tragic 80.4% |
| Seminole | 0.0 /100 | #326 | Tragic 80.4% |
| Sioux | 0.0 /100 | #327 | Tragic 80.2% |
| Creek | 0.0 /100 | #328 | Tragic 80.0% |
| Menominee | 0.0 /100 | #329 | Tragic 79.7% |
| Cheyenne | 0.0 /100 | #330 | Tragic 79.5% |
| Houma | 0.0 /100 | #331 | Tragic 79.5% |
| Ute | 0.0 /100 | #332 | Tragic 79.4% |
| Kiowa | 0.0 /100 | #333 | Tragic 79.2% |
| Yakama | 0.0 /100 | #334 | Tragic 79.0% |
| Natives/Alaskans | 0.0 /100 | #335 | Tragic 78.9% |
| Arapaho | 0.0 /100 | #336 | Tragic 78.1% |
Demographics Similar to Immigrants from St. Vincent and the Grenadines by In Labor Force | Age 35-44
In terms of in labor force | age 35-44, the demographic groups most similar to Immigrants from St. Vincent and the Grenadines are Indonesian (83.7%, a difference of 0.030%), Immigrants from Armenia (83.7%, a difference of 0.040%), Immigrants (83.7%, a difference of 0.060%), White/Caucasian (83.6%, a difference of 0.060%), and Salvadoran (83.6%, a difference of 0.070%).
| Demographics | Rating | Rank | In Labor Force | Age 35-44 |
| Immigrants | Cambodia | 1.1 /100 | #242 | Tragic 83.8% |
| Immigrants | Western Asia | 1.1 /100 | #243 | Tragic 83.8% |
| Guyanese | 1.1 /100 | #244 | Tragic 83.8% |
| Malaysians | 1.1 /100 | #245 | Tragic 83.8% |
| Immigrants | Immigrants | 1.0 /100 | #246 | Tragic 83.7% |
| Immigrants | Armenia | 0.9 /100 | #247 | Tragic 83.7% |
| Indonesians | 0.8 /100 | #248 | Tragic 83.7% |
| Immigrants | St. Vincent and the Grenadines | 0.7 /100 | #249 | Tragic 83.7% |
| Whites/Caucasians | 0.5 /100 | #250 | Tragic 83.6% |
| Salvadorans | 0.4 /100 | #251 | Tragic 83.6% |
| Immigrants | Guyana | 0.4 /100 | #252 | Tragic 83.6% |
| Lebanese | 0.4 /100 | #253 | Tragic 83.6% |
| Tongans | 0.4 /100 | #254 | Tragic 83.6% |
| Immigrants | Azores | 0.3 /100 | #255 | Tragic 83.6% |
| Japanese | 0.3 /100 | #256 | Tragic 83.6% |