Yugoslavian vs Immigrants from Afghanistan In Labor Force | Age 35-44
COMPARE
Yugoslavian
Immigrants from Afghanistan
In Labor Force | Age 35-44
In Labor Force | Age 35-44 Comparison
Yugoslavians
Immigrants from Afghanistan
84.9%
IN LABOR FORCE | AGE 35-44
97.7/ 100
METRIC RATING
88th/ 347
METRIC RANK
84.4%
IN LABOR FORCE | AGE 35-44
52.7/ 100
METRIC RATING
169th/ 347
METRIC RANK
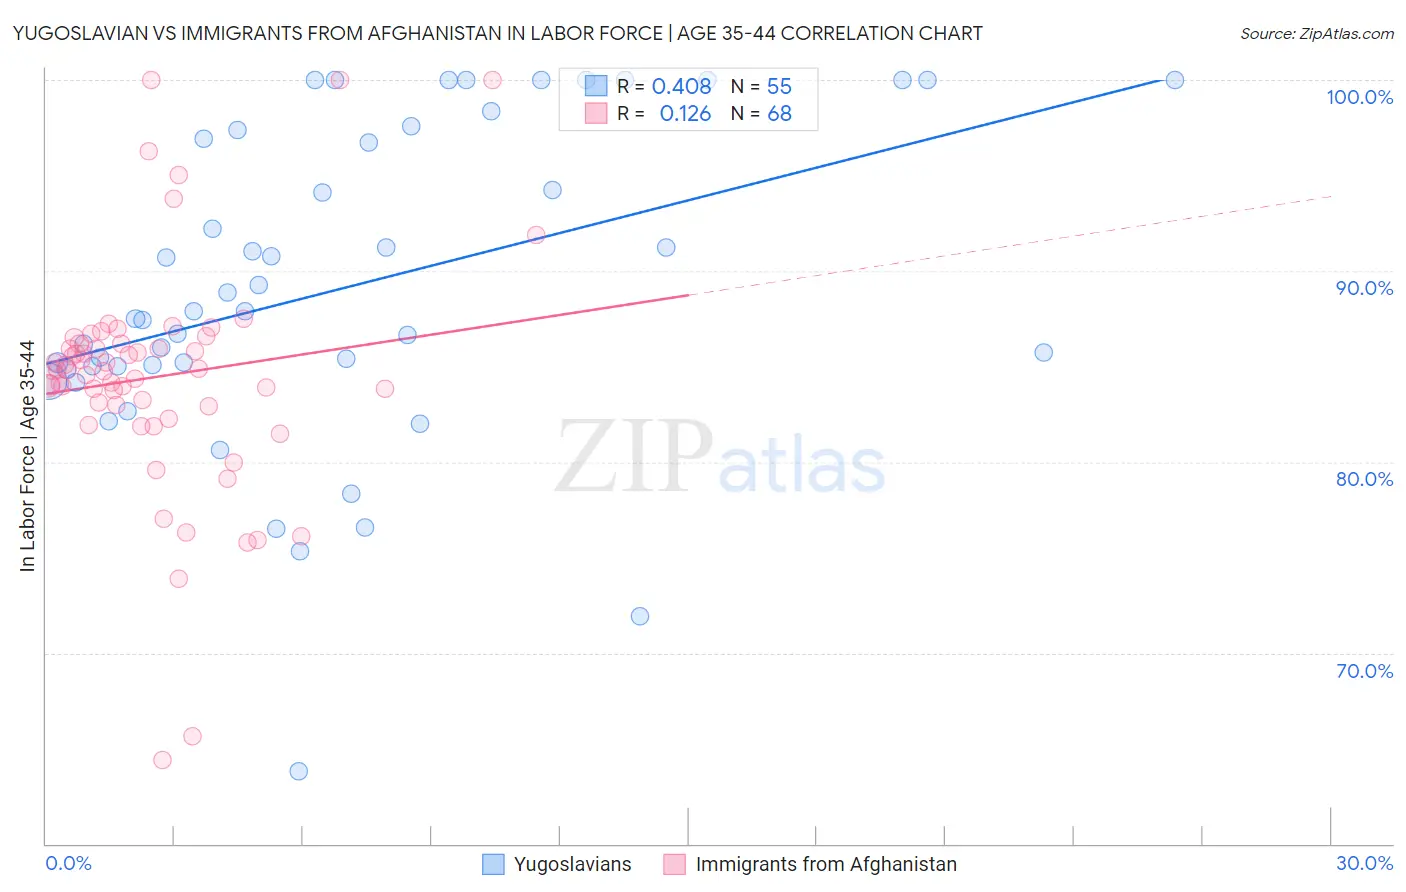
Yugoslavian vs Immigrants from Afghanistan In Labor Force | Age 35-44 Correlation Chart
The statistical analysis conducted on geographies consisting of 285,656,710 people shows a moderate positive correlation between the proportion of Yugoslavians and labor force participation rate among population between the ages 35 and 44 in the United States with a correlation coefficient (R) of 0.408 and weighted average of 84.9%. Similarly, the statistical analysis conducted on geographies consisting of 147,638,849 people shows a poor positive correlation between the proportion of Immigrants from Afghanistan and labor force participation rate among population between the ages 35 and 44 in the United States with a correlation coefficient (R) of 0.126 and weighted average of 84.4%, a difference of 0.59%.
In Labor Force | Age 35-44 Correlation Summary
| Measurement | Yugoslavian | Immigrants from Afghanistan |
| Minimum | 63.8% | 64.4% |
| Maximum | 100.0% | 100.0% |
| Range | 36.2% | 35.6% |
| Mean | 89.1% | 84.4% |
| Median | 87.9% | 84.8% |
| Interquartile 25% (IQ1) | 85.0% | 82.9% |
| Interquartile 75% (IQ3) | 97.4% | 86.2% |
| Interquartile Range (IQR) | 12.4% | 3.3% |
| Standard Deviation (Sample) | 8.3% | 6.1% |
| Standard Deviation (Population) | 8.2% | 6.1% |
Similar Demographics by In Labor Force | Age 35-44
Demographics Similar to Yugoslavians by In Labor Force | Age 35-44
In terms of in labor force | age 35-44, the demographic groups most similar to Yugoslavians are Greek (84.9%, a difference of 0.0%), Belgian (84.9%, a difference of 0.0%), Senegalese (84.9%, a difference of 0.010%), Immigrants from Peru (84.9%, a difference of 0.010%), and Immigrants from Middle Africa (84.9%, a difference of 0.010%).
| Demographics | Rating | Rank | In Labor Force | Age 35-44 |
| Immigrants | Eastern Europe | 98.3 /100 | #81 | Exceptional 84.9% |
| Immigrants | Sudan | 98.1 /100 | #82 | Exceptional 84.9% |
| Senegalese | 97.8 /100 | #83 | Exceptional 84.9% |
| Immigrants | Peru | 97.8 /100 | #84 | Exceptional 84.9% |
| Immigrants | Middle Africa | 97.8 /100 | #85 | Exceptional 84.9% |
| Greeks | 97.8 /100 | #86 | Exceptional 84.9% |
| Belgians | 97.7 /100 | #87 | Exceptional 84.9% |
| Yugoslavians | 97.7 /100 | #88 | Exceptional 84.9% |
| Immigrants | Pakistan | 97.5 /100 | #89 | Exceptional 84.9% |
| Immigrants | France | 97.4 /100 | #90 | Exceptional 84.9% |
| Immigrants | Europe | 97.2 /100 | #91 | Exceptional 84.9% |
| Ghanaians | 97.2 /100 | #92 | Exceptional 84.8% |
| Immigrants | Northern Africa | 97.1 /100 | #93 | Exceptional 84.8% |
| Mongolians | 96.8 /100 | #94 | Exceptional 84.8% |
| Immigrants | Kuwait | 96.7 /100 | #95 | Exceptional 84.8% |
Demographics Similar to Immigrants from Afghanistan by In Labor Force | Age 35-44
In terms of in labor force | age 35-44, the demographic groups most similar to Immigrants from Afghanistan are Irish (84.4%, a difference of 0.0%), Immigrants from Jordan (84.4%, a difference of 0.0%), Jordanian (84.4%, a difference of 0.010%), Scandinavian (84.4%, a difference of 0.010%), and Immigrants from Trinidad and Tobago (84.4%, a difference of 0.010%).
| Demographics | Rating | Rank | In Labor Force | Age 35-44 |
| Immigrants | Hungary | 59.4 /100 | #162 | Average 84.4% |
| Aleuts | 59.1 /100 | #163 | Average 84.4% |
| Nigerians | 58.9 /100 | #164 | Average 84.4% |
| Venezuelans | 58.1 /100 | #165 | Average 84.4% |
| Alsatians | 55.2 /100 | #166 | Average 84.4% |
| Immigrants | Portugal | 55.2 /100 | #167 | Average 84.4% |
| Irish | 53.1 /100 | #168 | Average 84.4% |
| Immigrants | Afghanistan | 52.7 /100 | #169 | Average 84.4% |
| Immigrants | Jordan | 52.5 /100 | #170 | Average 84.4% |
| Jordanians | 51.7 /100 | #171 | Average 84.4% |
| Scandinavians | 51.2 /100 | #172 | Average 84.4% |
| Immigrants | Trinidad and Tobago | 50.7 /100 | #173 | Average 84.4% |
| Immigrants | Iran | 50.0 /100 | #174 | Average 84.4% |
| Pakistanis | 48.2 /100 | #175 | Average 84.4% |
| Sri Lankans | 47.3 /100 | #176 | Average 84.4% |