Menominee vs Immigrants from Afghanistan Unemployment Among Women with Children Ages 6 to 17 years
COMPARE
Menominee
Immigrants from Afghanistan
Unemployment Among Women with Children Ages 6 to 17 years
Unemployment Among Women with Children Ages 6 to 17 years Comparison
Menominee
Immigrants from Afghanistan
9.0%
UNEMPLOYMENT AMONG WOMEN WITH CHILDREN AGES 6 TO 17 YEARS
39.3/ 100
METRIC RATING
178th/ 347
METRIC RANK
7.8%
UNEMPLOYMENT AMONG WOMEN WITH CHILDREN AGES 6 TO 17 YEARS
100.0/ 100
METRIC RATING
27th/ 347
METRIC RANK
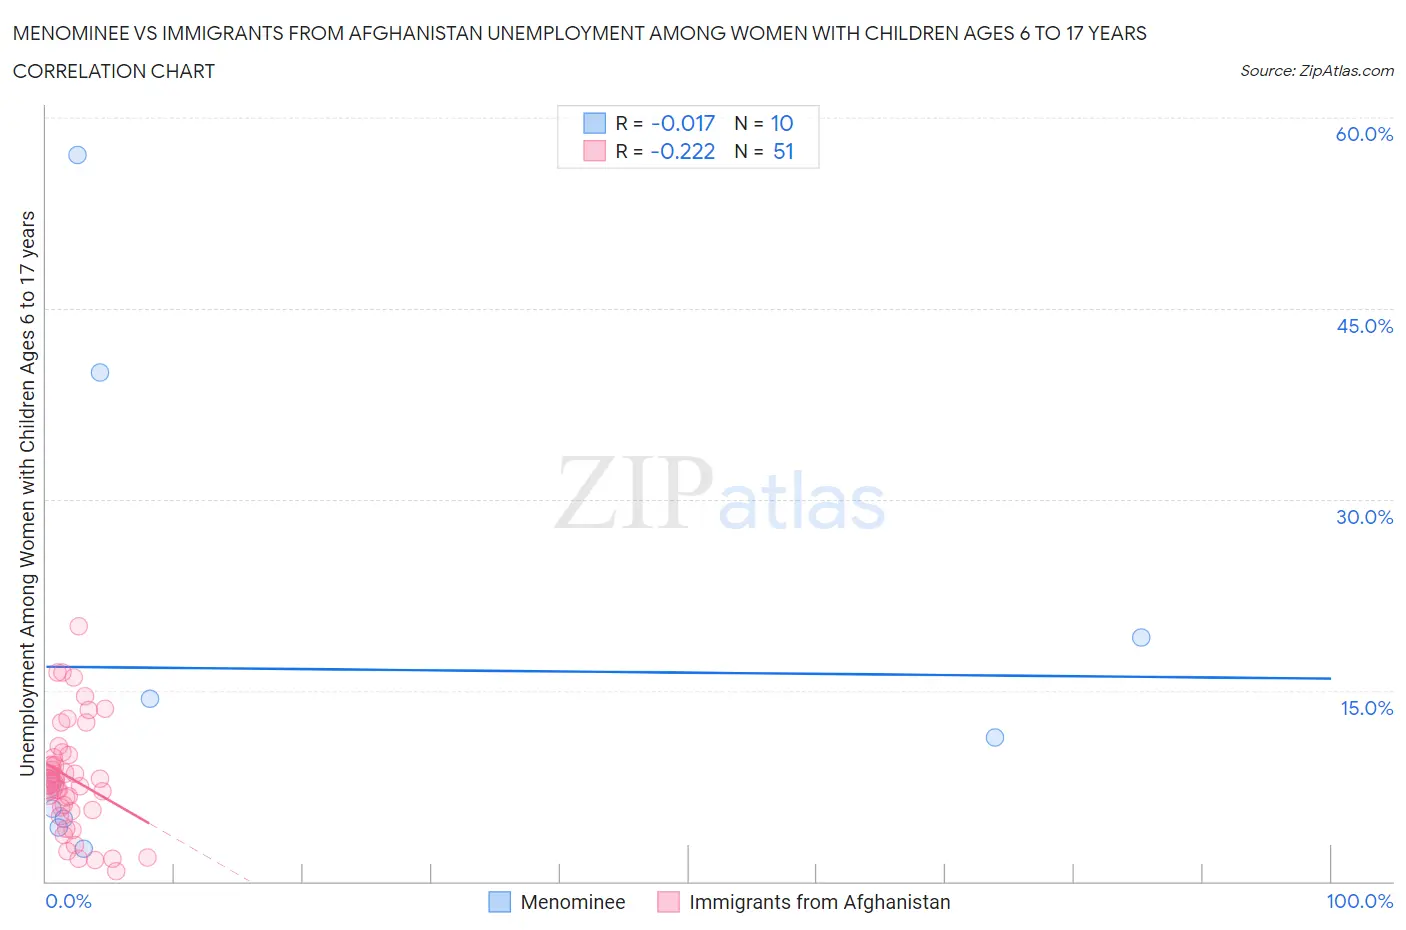
Menominee vs Immigrants from Afghanistan Unemployment Among Women with Children Ages 6 to 17 years Correlation Chart
The statistical analysis conducted on geographies consisting of 40,123,903 people shows no correlation between the proportion of Menominee and unemployment rate among women with children between the ages 6 and 17 in the United States with a correlation coefficient (R) of -0.017 and weighted average of 9.0%. Similarly, the statistical analysis conducted on geographies consisting of 127,539,801 people shows a weak negative correlation between the proportion of Immigrants from Afghanistan and unemployment rate among women with children between the ages 6 and 17 in the United States with a correlation coefficient (R) of -0.222 and weighted average of 7.8%, a difference of 15.9%.
Unemployment Among Women with Children Ages 6 to 17 years Correlation Summary
| Measurement | Menominee | Immigrants from Afghanistan |
| Minimum | 2.6% | 0.80% |
| Maximum | 57.1% | 20.1% |
| Range | 54.5% | 19.3% |
| Mean | 16.7% | 8.1% |
| Median | 9.5% | 7.7% |
| Interquartile 25% (IQ1) | 4.9% | 5.6% |
| Interquartile 75% (IQ3) | 19.1% | 9.9% |
| Interquartile Range (IQR) | 14.2% | 4.3% |
| Standard Deviation (Sample) | 18.0% | 4.2% |
| Standard Deviation (Population) | 17.1% | 4.2% |
Similar Demographics by Unemployment Among Women with Children Ages 6 to 17 years
Demographics Similar to Menominee by Unemployment Among Women with Children Ages 6 to 17 years
In terms of unemployment among women with children ages 6 to 17 years, the demographic groups most similar to Menominee are Immigrants from Zaire (9.0%, a difference of 0.040%), Ethiopian (9.0%, a difference of 0.080%), Immigrants from Jordan (9.0%, a difference of 0.11%), Immigrants from Italy (9.0%, a difference of 0.20%), and Immigrants from Czechoslovakia (9.0%, a difference of 0.23%).
| Demographics | Rating | Rank | Unemployment Among Women with Children Ages 6 to 17 years |
| Jordanians | 52.2 /100 | #171 | Average 9.0% |
| Immigrants | West Indies | 52.2 /100 | #172 | Average 9.0% |
| Immigrants | Brazil | 51.0 /100 | #173 | Average 9.0% |
| Immigrants | Costa Rica | 50.0 /100 | #174 | Average 9.0% |
| Immigrants | Sierra Leone | 45.9 /100 | #175 | Average 9.0% |
| Immigrants | Italy | 43.7 /100 | #176 | Average 9.0% |
| Immigrants | Jordan | 41.6 /100 | #177 | Average 9.0% |
| Menominee | 39.3 /100 | #178 | Fair 9.0% |
| Immigrants | Zaire | 38.3 /100 | #179 | Fair 9.0% |
| Ethiopians | 37.6 /100 | #180 | Fair 9.0% |
| Immigrants | Czechoslovakia | 34.5 /100 | #181 | Fair 9.0% |
| South American Indians | 34.4 /100 | #182 | Fair 9.0% |
| Swiss | 33.5 /100 | #183 | Fair 9.0% |
| Palestinians | 33.4 /100 | #184 | Fair 9.0% |
| Immigrants | Congo | 32.5 /100 | #185 | Fair 9.0% |
Demographics Similar to Immigrants from Afghanistan by Unemployment Among Women with Children Ages 6 to 17 years
In terms of unemployment among women with children ages 6 to 17 years, the demographic groups most similar to Immigrants from Afghanistan are Immigrants from Uzbekistan (7.8%, a difference of 0.33%), Immigrants from Eastern Asia (7.7%, a difference of 0.63%), Indian (Asian) (7.7%, a difference of 0.63%), Thai (7.8%, a difference of 0.67%), and Immigrants from Indonesia (7.7%, a difference of 0.76%).
| Demographics | Rating | Rank | Unemployment Among Women with Children Ages 6 to 17 years |
| Immigrants | Singapore | 100.0 /100 | #20 | Exceptional 7.7% |
| Immigrants | India | 100.0 /100 | #21 | Exceptional 7.7% |
| Immigrants | China | 100.0 /100 | #22 | Exceptional 7.7% |
| Immigrants | Indonesia | 100.0 /100 | #23 | Exceptional 7.7% |
| Nepalese | 100.0 /100 | #24 | Exceptional 7.7% |
| Immigrants | Eastern Asia | 100.0 /100 | #25 | Exceptional 7.7% |
| Indians (Asian) | 100.0 /100 | #26 | Exceptional 7.7% |
| Immigrants | Afghanistan | 100.0 /100 | #27 | Exceptional 7.8% |
| Immigrants | Uzbekistan | 100.0 /100 | #28 | Exceptional 7.8% |
| Thais | 100.0 /100 | #29 | Exceptional 7.8% |
| Immigrants | Iran | 100.0 /100 | #30 | Exceptional 7.9% |
| Laotians | 100.0 /100 | #31 | Exceptional 7.9% |
| Immigrants | Cambodia | 100.0 /100 | #32 | Exceptional 7.9% |
| Immigrants | Korea | 100.0 /100 | #33 | Exceptional 7.9% |
| Native Hawaiians | 100.0 /100 | #34 | Exceptional 7.9% |