Menominee vs Immigrants from Zimbabwe In Labor Force | Age 35-44
COMPARE
Menominee
Immigrants from Zimbabwe
In Labor Force | Age 35-44
In Labor Force | Age 35-44 Comparison
Menominee
Immigrants from Zimbabwe
79.7%
IN LABOR FORCE | AGE 35-44
0.0/ 100
METRIC RATING
329th/ 347
METRIC RANK
85.2%
IN LABOR FORCE | AGE 35-44
99.8/ 100
METRIC RATING
41st/ 347
METRIC RANK
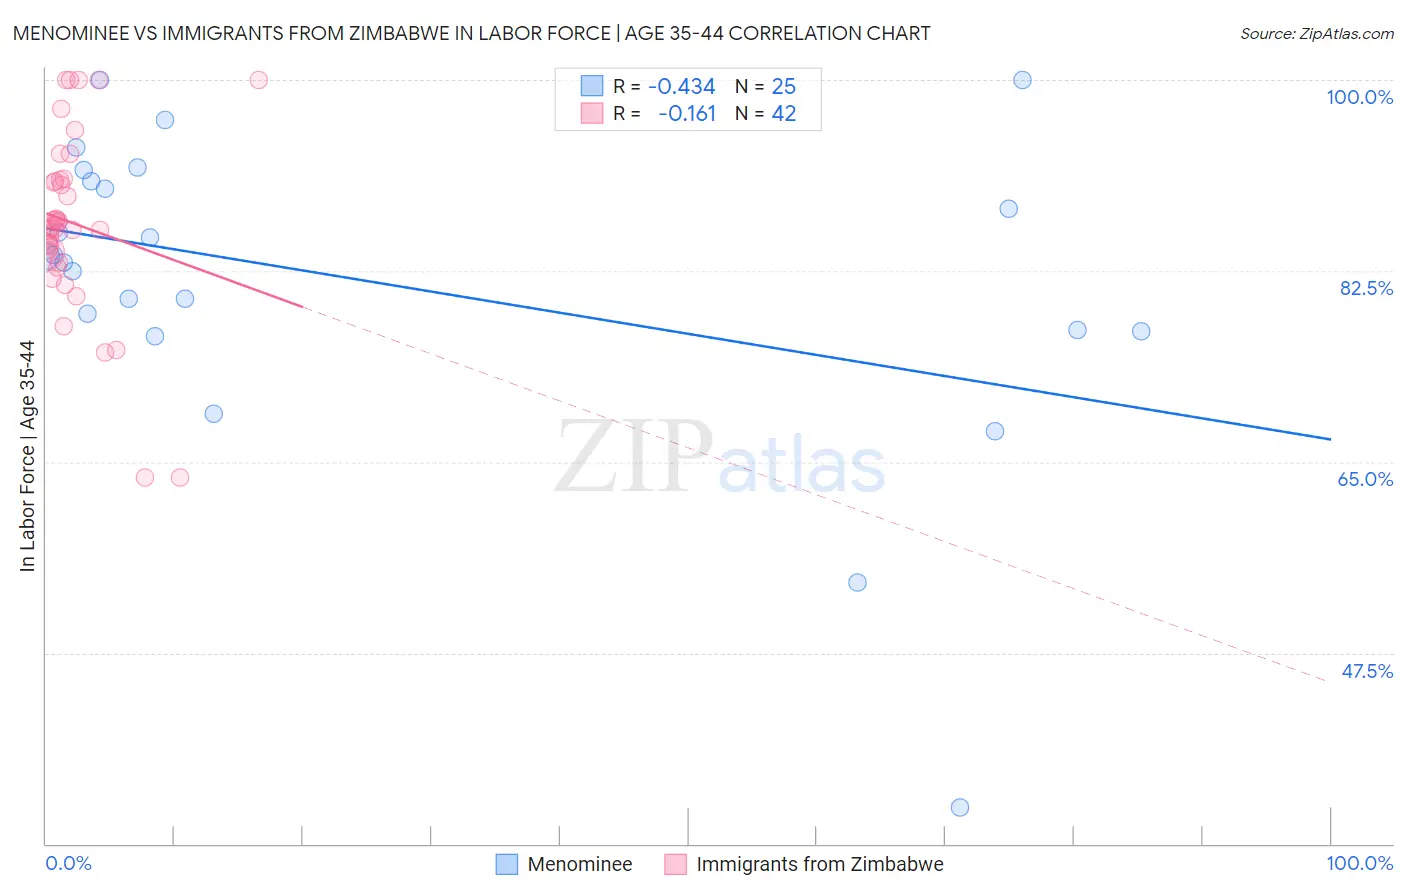
Menominee vs Immigrants from Zimbabwe In Labor Force | Age 35-44 Correlation Chart
The statistical analysis conducted on geographies consisting of 45,777,730 people shows a moderate negative correlation between the proportion of Menominee and labor force participation rate among population between the ages 35 and 44 in the United States with a correlation coefficient (R) of -0.434 and weighted average of 79.7%. Similarly, the statistical analysis conducted on geographies consisting of 117,794,320 people shows a poor negative correlation between the proportion of Immigrants from Zimbabwe and labor force participation rate among population between the ages 35 and 44 in the United States with a correlation coefficient (R) of -0.161 and weighted average of 85.2%, a difference of 7.0%.
In Labor Force | Age 35-44 Correlation Summary
| Measurement | Menominee | Immigrants from Zimbabwe |
| Minimum | 33.3% | 63.6% |
| Maximum | 100.0% | 100.0% |
| Range | 66.7% | 36.4% |
| Mean | 81.7% | 86.9% |
| Median | 83.9% | 86.5% |
| Interquartile 25% (IQ1) | 77.0% | 84.1% |
| Interquartile 75% (IQ3) | 91.2% | 90.8% |
| Interquartile Range (IQR) | 14.2% | 6.7% |
| Standard Deviation (Sample) | 14.5% | 8.3% |
| Standard Deviation (Population) | 14.2% | 8.2% |
Similar Demographics by In Labor Force | Age 35-44
Demographics Similar to Menominee by In Labor Force | Age 35-44
In terms of in labor force | age 35-44, the demographic groups most similar to Menominee are Cheyenne (79.5%, a difference of 0.20%), Houma (79.5%, a difference of 0.22%), Ute (79.4%, a difference of 0.28%), Creek (80.0%, a difference of 0.44%), and Kiowa (79.2%, a difference of 0.61%).
| Demographics | Rating | Rank | In Labor Force | Age 35-44 |
| Paiute | 0.0 /100 | #322 | Tragic 80.6% |
| Yaqui | 0.0 /100 | #323 | Tragic 80.5% |
| Choctaw | 0.0 /100 | #324 | Tragic 80.5% |
| Dutch West Indians | 0.0 /100 | #325 | Tragic 80.4% |
| Seminole | 0.0 /100 | #326 | Tragic 80.4% |
| Sioux | 0.0 /100 | #327 | Tragic 80.2% |
| Creek | 0.0 /100 | #328 | Tragic 80.0% |
| Menominee | 0.0 /100 | #329 | Tragic 79.7% |
| Cheyenne | 0.0 /100 | #330 | Tragic 79.5% |
| Houma | 0.0 /100 | #331 | Tragic 79.5% |
| Ute | 0.0 /100 | #332 | Tragic 79.4% |
| Kiowa | 0.0 /100 | #333 | Tragic 79.2% |
| Yakama | 0.0 /100 | #334 | Tragic 79.0% |
| Natives/Alaskans | 0.0 /100 | #335 | Tragic 78.9% |
| Arapaho | 0.0 /100 | #336 | Tragic 78.1% |
Demographics Similar to Immigrants from Zimbabwe by In Labor Force | Age 35-44
In terms of in labor force | age 35-44, the demographic groups most similar to Immigrants from Zimbabwe are Immigrants from Bulgaria (85.2%, a difference of 0.0%), Macedonian (85.2%, a difference of 0.0%), Immigrants from Poland (85.2%, a difference of 0.010%), Eastern European (85.2%, a difference of 0.010%), and Polish (85.2%, a difference of 0.010%).
| Demographics | Rating | Rank | In Labor Force | Age 35-44 |
| Immigrants | Nepal | 99.9 /100 | #34 | Exceptional 85.3% |
| Estonians | 99.9 /100 | #35 | Exceptional 85.3% |
| Immigrants | Morocco | 99.8 /100 | #36 | Exceptional 85.2% |
| Kenyans | 99.8 /100 | #37 | Exceptional 85.2% |
| Immigrants | Poland | 99.8 /100 | #38 | Exceptional 85.2% |
| Eastern Europeans | 99.8 /100 | #39 | Exceptional 85.2% |
| Immigrants | Bulgaria | 99.8 /100 | #40 | Exceptional 85.2% |
| Immigrants | Zimbabwe | 99.8 /100 | #41 | Exceptional 85.2% |
| Macedonians | 99.8 /100 | #42 | Exceptional 85.2% |
| Poles | 99.8 /100 | #43 | Exceptional 85.2% |
| Lithuanians | 99.8 /100 | #44 | Exceptional 85.2% |
| Cypriots | 99.8 /100 | #45 | Exceptional 85.2% |
| Immigrants | Hong Kong | 99.8 /100 | #46 | Exceptional 85.2% |
| German Russians | 99.8 /100 | #47 | Exceptional 85.2% |
| Immigrants | Eritrea | 99.7 /100 | #48 | Exceptional 85.2% |