Immigrants from China vs Immigrants from Afghanistan In Labor Force | Age 35-44
COMPARE
Immigrants from China
Immigrants from Afghanistan
In Labor Force | Age 35-44
In Labor Force | Age 35-44 Comparison
Immigrants from China
Immigrants from Afghanistan
84.7%
IN LABOR FORCE | AGE 35-44
92.3/ 100
METRIC RATING
117th/ 347
METRIC RANK
84.4%
IN LABOR FORCE | AGE 35-44
52.7/ 100
METRIC RATING
169th/ 347
METRIC RANK
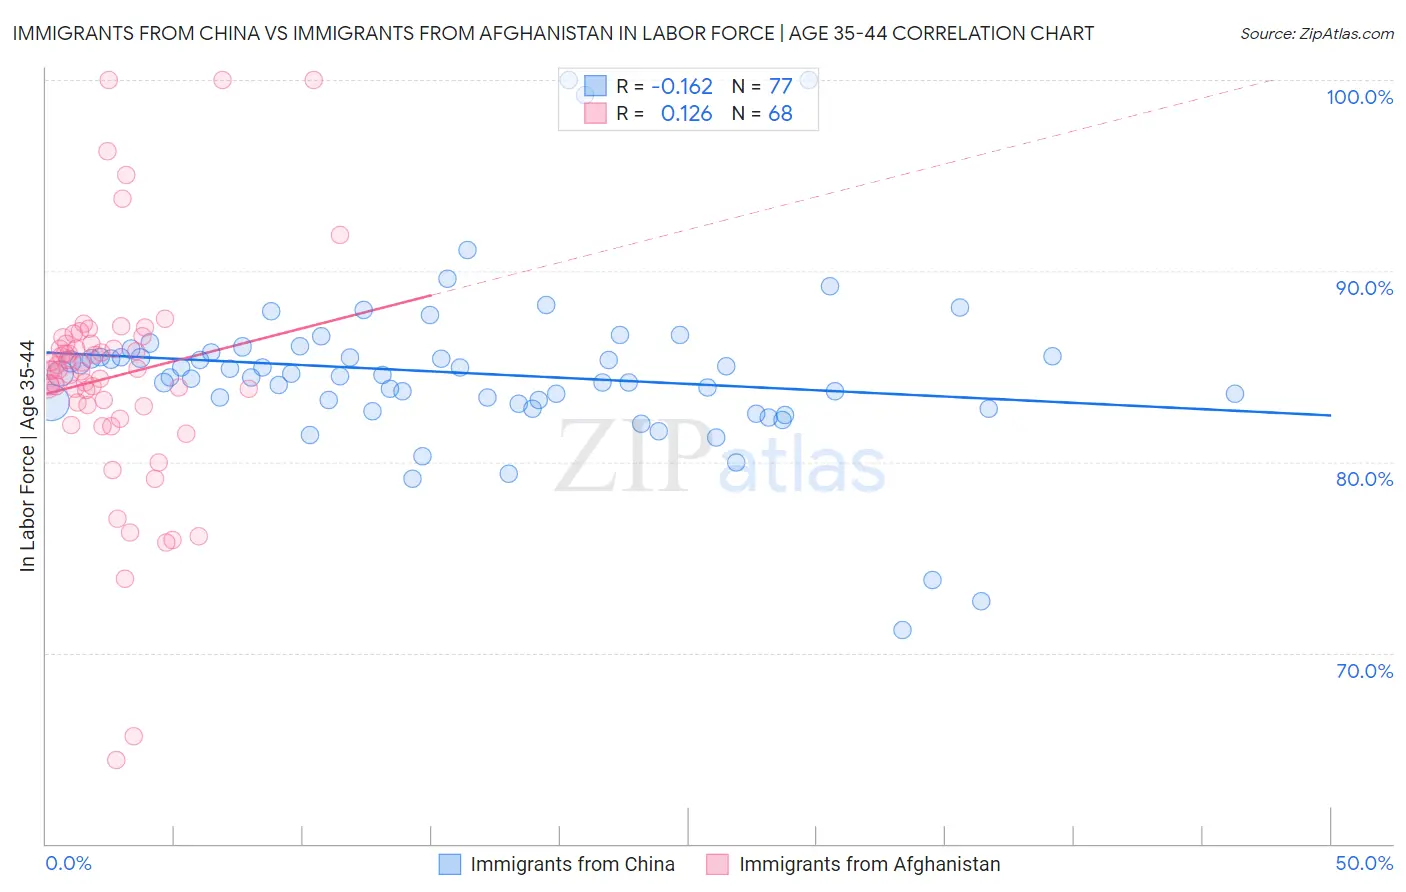
Immigrants from China vs Immigrants from Afghanistan In Labor Force | Age 35-44 Correlation Chart
The statistical analysis conducted on geographies consisting of 456,678,998 people shows a poor negative correlation between the proportion of Immigrants from China and labor force participation rate among population between the ages 35 and 44 in the United States with a correlation coefficient (R) of -0.162 and weighted average of 84.7%. Similarly, the statistical analysis conducted on geographies consisting of 147,638,849 people shows a poor positive correlation between the proportion of Immigrants from Afghanistan and labor force participation rate among population between the ages 35 and 44 in the United States with a correlation coefficient (R) of 0.126 and weighted average of 84.4%, a difference of 0.38%.
In Labor Force | Age 35-44 Correlation Summary
| Measurement | Immigrants from China | Immigrants from Afghanistan |
| Minimum | 71.2% | 64.4% |
| Maximum | 100.0% | 100.0% |
| Range | 28.8% | 35.6% |
| Mean | 84.6% | 84.4% |
| Median | 84.5% | 84.8% |
| Interquartile 25% (IQ1) | 83.1% | 82.9% |
| Interquartile 75% (IQ3) | 85.6% | 86.2% |
| Interquartile Range (IQR) | 2.5% | 3.3% |
| Standard Deviation (Sample) | 4.4% | 6.1% |
| Standard Deviation (Population) | 4.4% | 6.1% |
Similar Demographics by In Labor Force | Age 35-44
Demographics Similar to Immigrants from China by In Labor Force | Age 35-44
In terms of in labor force | age 35-44, the demographic groups most similar to Immigrants from China are Immigrants from Eastern Asia (84.7%, a difference of 0.0%), Immigrants from Egypt (84.7%, a difference of 0.010%), Burmese (84.7%, a difference of 0.010%), Uruguayan (84.7%, a difference of 0.020%), and Chilean (84.7%, a difference of 0.020%).
| Demographics | Rating | Rank | In Labor Force | Age 35-44 |
| Filipinos | 93.8 /100 | #110 | Exceptional 84.7% |
| Ukrainians | 93.5 /100 | #111 | Exceptional 84.7% |
| Immigrants | Western Africa | 93.4 /100 | #112 | Exceptional 84.7% |
| Uruguayans | 93.3 /100 | #113 | Exceptional 84.7% |
| Chileans | 93.2 /100 | #114 | Exceptional 84.7% |
| Bahamians | 93.2 /100 | #115 | Exceptional 84.7% |
| Immigrants | Egypt | 92.7 /100 | #116 | Exceptional 84.7% |
| Immigrants | China | 92.3 /100 | #117 | Exceptional 84.7% |
| Immigrants | Eastern Asia | 92.1 /100 | #118 | Exceptional 84.7% |
| Burmese | 91.8 /100 | #119 | Exceptional 84.7% |
| Immigrants | Northern Europe | 91.5 /100 | #120 | Exceptional 84.7% |
| Finns | 91.2 /100 | #121 | Exceptional 84.7% |
| Germans | 91.0 /100 | #122 | Exceptional 84.7% |
| Immigrants | South America | 90.9 /100 | #123 | Exceptional 84.7% |
| Slavs | 90.8 /100 | #124 | Exceptional 84.7% |
Demographics Similar to Immigrants from Afghanistan by In Labor Force | Age 35-44
In terms of in labor force | age 35-44, the demographic groups most similar to Immigrants from Afghanistan are Irish (84.4%, a difference of 0.0%), Immigrants from Jordan (84.4%, a difference of 0.0%), Jordanian (84.4%, a difference of 0.010%), Scandinavian (84.4%, a difference of 0.010%), and Immigrants from Trinidad and Tobago (84.4%, a difference of 0.010%).
| Demographics | Rating | Rank | In Labor Force | Age 35-44 |
| Immigrants | Hungary | 59.4 /100 | #162 | Average 84.4% |
| Aleuts | 59.1 /100 | #163 | Average 84.4% |
| Nigerians | 58.9 /100 | #164 | Average 84.4% |
| Venezuelans | 58.1 /100 | #165 | Average 84.4% |
| Alsatians | 55.2 /100 | #166 | Average 84.4% |
| Immigrants | Portugal | 55.2 /100 | #167 | Average 84.4% |
| Irish | 53.1 /100 | #168 | Average 84.4% |
| Immigrants | Afghanistan | 52.7 /100 | #169 | Average 84.4% |
| Immigrants | Jordan | 52.5 /100 | #170 | Average 84.4% |
| Jordanians | 51.7 /100 | #171 | Average 84.4% |
| Scandinavians | 51.2 /100 | #172 | Average 84.4% |
| Immigrants | Trinidad and Tobago | 50.7 /100 | #173 | Average 84.4% |
| Immigrants | Iran | 50.0 /100 | #174 | Average 84.4% |
| Pakistanis | 48.2 /100 | #175 | Average 84.4% |
| Sri Lankans | 47.3 /100 | #176 | Average 84.4% |